
Code Optimization Techniques to Speed Up Apps


Speed matters, not just for user experience, but for conversion rates, retention, infrastructure cost, and team velocity. The good news is that most “slow app” problems are not solved by heroic micro-optimizations. They’re solved by a repeatable process: measure real bottlenecks, fix the highest-impact constraints first, then prevent regressions with guardrails.
This guide walks through practical code optimization techniques to speed up apps across frontend, backend, and data layers, with an emphasis on changes that reliably move the needle.
Start with measurement (or you’ll optimize the wrong thing)
Before touching code, align on what “faster” means, and capture a baseline. Teams often chase average response times, while users suffer from the slowest 1 to 5 percent of requests.
Pick performance goals that match the product
A good baseline set of targets usually includes:
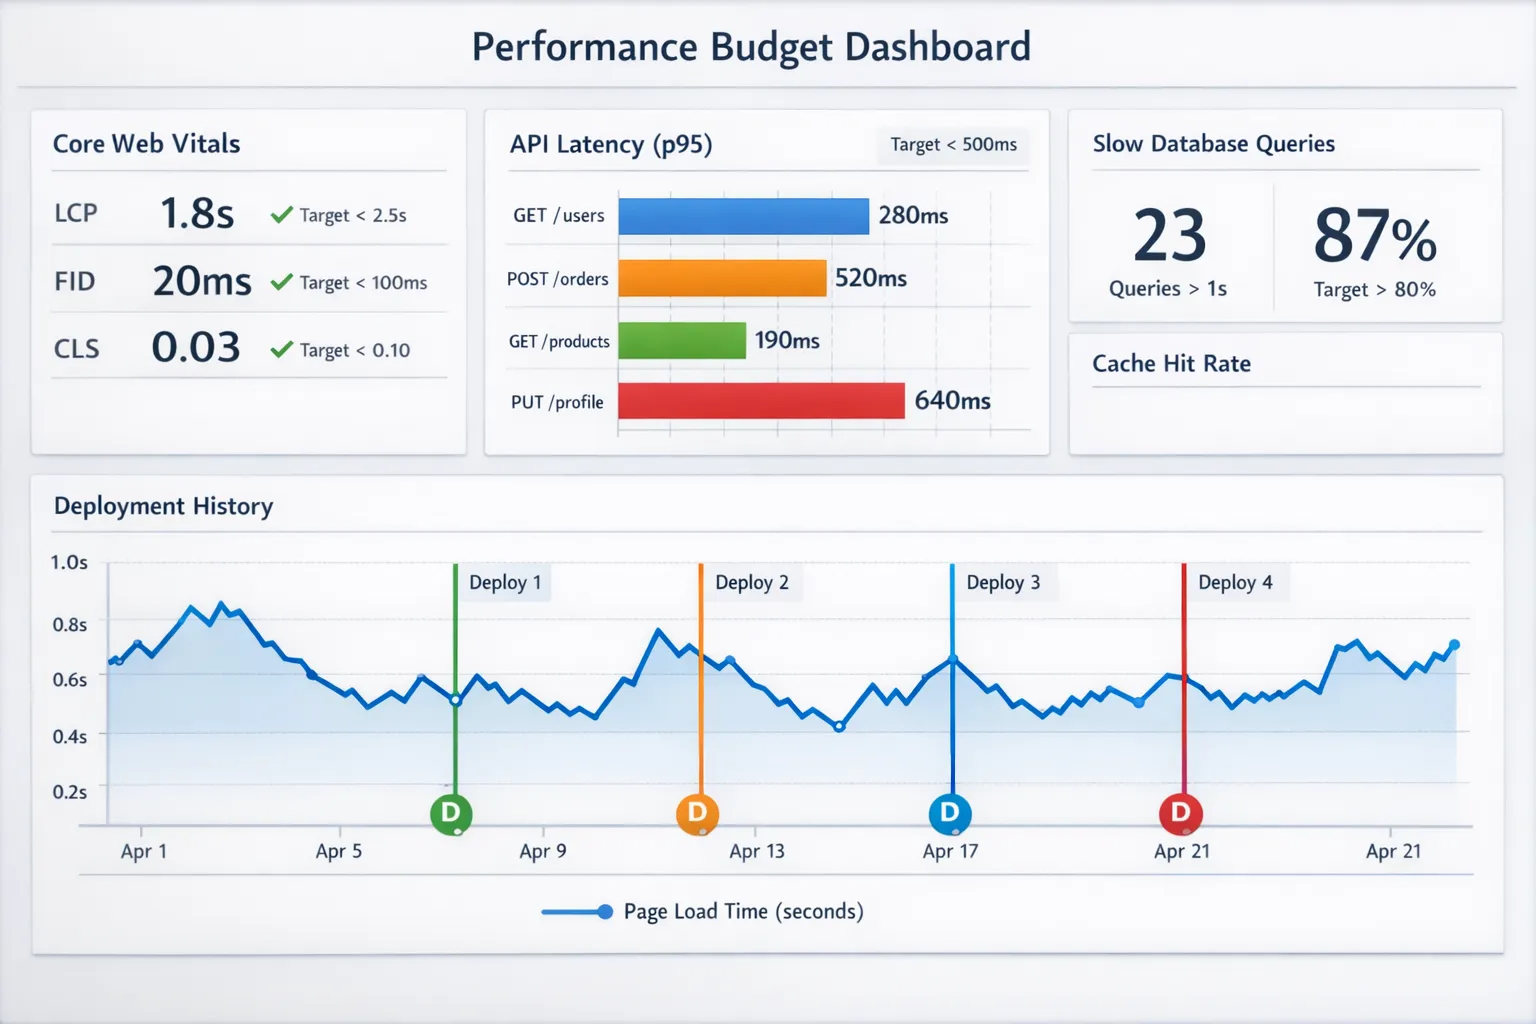
- User-perceived performance: Core Web Vitals (LCP, INP, CLS) for web experiences. Google’s definitions and thresholds are documented on web.dev.
- API latency percentiles: p50, p95, p99 per endpoint (and per tenant, region, or plan if applicable).
- Throughput and saturation: requests per second vs CPU, memory, DB connections, queue depth.
- Cost and efficiency: cost per 1,000 requests, cost per active user, cache hit rate.
If you only track one metric, track p95 latency for the top endpoints or user journeys. It correlates far better with real experience than averages.
Use the right tooling for the layer
You want evidence that points to the bottleneck, not guesses.
- Frontend: browser Performance panel, Lighthouse, framework-specific profilers (React DevTools Profiler).
- Backend: continuous profiling (where possible), flame graphs, request traces.
- Distributed systems: OpenTelemetry for traces and metrics, with consistent context propagation. Start with the OpenTelemetry documentation to standardize instrumentation.
- Database: slow query logs, query plans, index usage, lock/timeout metrics.
A useful discipline is to always answer: “Is this CPU, memory, disk I/O, network I/O, or lock contention?” Once you can name the constraint, the optimization options become obvious.

High-impact code optimization techniques (in the order they usually pay off)
1) Eliminate wasted work in hot paths
Most apps are slow because they do unnecessary work, too often, in the most frequently executed paths.
Common examples:
- Recomputing expensive values on every request instead of caching or memoizing.
- Performing repeated parsing/serialization (for example, mapping the same large JSON payload multiple times).
- Calling downstream services more than necessary (chatty APIs).
Technique: make hot paths boring. Identify your top endpoints or user flows, then aim for fewer allocations, fewer loops, fewer round trips, and fewer “helper” abstractions that look clean but add layers of overhead.
A practical heuristic: if a function runs for every request (or every keystroke), treat it like a budgeted resource.
2) Improve algorithmic complexity and data structures
This is the highest-leverage category because it changes how performance scales.
Look for:
- Accidental O(n²): nested loops over large lists, repeated
.find()inside.map(), sorting in a loop. - Inefficient lookups: arrays used as maps, linear scans instead of hash lookups.
- Redundant transformations: mapping large arrays multiple times when one pass would do.
Example (JavaScript/TypeScript): replacing repeated linear searches with a precomputed map.
// Before: O(n*m) if you do a find for every row
const enriched = rows.map(r => ({
  ...r,
  account: accounts.find(a => a.id === r.accountId),
}))

// After: O(n+m)
const byId = new Map(accounts.map(a => [a.id, a]))
const enriched2 = rows.map(r => ({
  ...r,
  account: byId.get(r.accountId),
}))
In practice, these changes often cut CPU time drastically, and they reduce cloud spend because you need fewer instances to handle the same load.
3) Fix N+1 calls and round-trip amplification
N+1 is not only a database problem. It appears everywhere:
- UI loads a list, then fetches details item-by-item.
- API aggregates a response by calling another service repeatedly.
- Background job processes 10,000 items and performs a network call for each.
Optimization patterns that work well:
- Batch reads and writes.
- Prefetch related data (carefully) to keep the number of calls constant.
- Use join-based queries or precomputed views where appropriate.
- Introduce a single purpose endpoint that returns “what the screen needs” to avoid a waterfall of requests.
The fastest call is the one you don’t make.
4) Cache deliberately (and invalidate safely)
Caching is one of the most effective speed-up techniques, but only if you treat it like a system with correctness requirements.
Useful cache layers:
- HTTP and CDN caching: cache static assets and cacheable responses close to users.
- Application-level caching: memoize expensive computations, cache reference data, cache authorization decisions when safe.
- Database-side caching: avoid repeated heavy aggregations with materialized views or precomputed tables, when the domain allows it.
What to get right:
- Cache keys: include tenant, locale, and authorization dimensions.
- TTL strategy: short TTL for volatile data, longer TTL for reference data.
- Negative caching: cache “not found” results briefly to prevent repeated misses.
- Stampede protection: prevent hundreds of concurrent requests from recomputing the same value.
5) Optimize database queries, not just application code
Many “code optimization” projects stall because the real bottleneck is in data access.
High-payoff database techniques:
- Add the right indexes: based on real query patterns, not guesses.
- Read query plans: confirm you are not doing sequential scans on large tables.
- Return fewer columns: avoid
SELECT *on wide rows. - Pagination that scales: offset pagination degrades at high offsets; keyset pagination often performs better.
- Connection pooling: reduce connection churn and protect the database.
- Avoid lock contention: long transactions, hot rows, and frequent updates can create latency spikes.
A reliable workflow:
- Identify top slow queries by total time (not just per-call time).
- Explain/analyze them.
- Add indexes or rewrite queries.
- Re-check plans after each change.
If you need a starting point for analysis discipline, PostgreSQL’s documentation on using EXPLAIN is clear and practical: Using EXPLAIN.
6) Reduce frontend payload and main-thread work
For many apps, “the app is slow” means the browser is doing too much.
High-impact frontend optimizations:
- Reduce JavaScript shipped: code split by route, remove dead code, prefer smaller libraries.
- Cut rerenders: avoid unnecessary state updates, memoize expensive computations, virtualize large lists.
- Optimize images: responsive sizes, modern formats, lazy-load below the fold.
- Avoid long tasks: keep the main thread responsive, especially for interaction latency (INP).
If you run React, a typical win is to profile a slow page, then eliminate rerender cascades caused by over-broad state or unstable props.
If your stack includes Next.js, be careful not to treat generic web performance advice as a substitute for architecture decisions. Rendering strategy, caching strategy, and data-fetch boundaries can dominate performance. (Wolf-Tech covers those considerations in other posts, so this article stays framework-agnostic.)
7) Manage concurrency, backpressure, and timeouts
In backends and distributed systems, speed problems often show up as overload problems.
Symptoms:
- Latency is fine in dev, but p99 explodes in production.
- Throughput plateaus even when you add more instances.
- The database looks “fine” until connection limits hit.
Optimization techniques:
- Add timeouts everywhere: requests, DB queries, external calls.
- Apply backpressure: bounded queues, concurrency limits per downstream.
- Use bulkheads and circuit breakers: isolate failures so one slow dependency does not take out the whole system.
- Prefer async I/O for I/O-bound workloads: avoid thread-per-request designs that collapse under wait-heavy traffic.
This category improves speed by preventing tail latency, not by shaving microseconds.
8) Reduce memory churn and unnecessary allocations
Garbage-collected runtimes (JVM, .NET, Node.js, Go with GC) can show latency spikes from allocation pressure.
Tactics that commonly help:
- Avoid creating large intermediate arrays or objects in hot paths.
- Stream where possible (process data incrementally instead of building huge in-memory structures).
- Reuse buffers in performance-critical code.
- Watch for accidental caching of large objects that should expire.
If you suspect GC-related issues, a profiler that can attribute allocations is often more valuable than CPU-only profiling.
A practical triage map: symptom to first move
When you’re under pressure, it helps to make investigation predictable. This table is intentionally conservative: it lists first checks that most often surface the actual bottleneck.
| Symptom in production | Most likely bottleneck | First investigation step | Typical fix class |
|---|---|---|---|
| p95 and p99 latency spike during traffic peaks | Saturation, lock contention, downstream timeouts | Check CPU, DB connections, queue depth, dependency latency | Backpressure, pooling, query optimization, bulkheads |
| Slow list views, “loading…” after navigation | Frontend bundle, data waterfall | Browser waterfall + React/JS profiler | Code splitting, reduce requests, batch APIs |
| One endpoint dominates infra cost | Inefficient algorithm or query | Trace to expensive spans, profile endpoint | Algorithmic improvements, indexing, caching |
| Latency stable but throughput capped | Contention or single-thread bottleneck | CPU profiling + thread/event loop utilization | Parallelism, remove serialization points |
| Random latency spikes with no traffic change | GC, noisy neighbor, background jobs | Allocation profiling, node heap, container limits | Reduce allocations, tune memory, isolate workloads |
Prevent regressions: optimization is a system, not a sprint
Teams often speed up an app, then slowly lose the gains over 3 to 6 months. The fix is to make performance a normal part of delivery.
Set performance budgets
Pick a small set of budgets tied to user experience and cost, for example:
- Max JS per route (compressed)
- LCP and INP targets for key pages
- p95 latency per critical endpoint
- Max DB queries per request for known hot paths
Budgets create a clear “definition of done” for performance.
Add performance checks to CI
This does not need to be heavy:
- Run a basic Lighthouse check for core flows.
- Track bundle size deltas.
- Run a small load test on the top endpoints (even 5 to 10 minutes) to catch obvious regressions.
Instrument what matters
If you want optimization to stick, you need to see it.
- Traces that show where time went (including DB and external calls)
- Metrics that show saturation and error rates
- Logs that let you correlate slow paths with inputs (tenant, payload size, feature flag, version)
If you’re building toward reliability and speed together, standardizing SLIs/SLOs and monitoring pays off quickly. (Wolf-Tech’s broader reliability playbooks also apply here.)
What not to do (common optimization traps)
Don’t optimize without a benchmark
If you can’t measure before and after, you can’t know if the change worked, and you can’t defend it later.
Don’t chase micro-optimizations while you have macro bottlenecks
Changing a small loop might save milliseconds. Removing an N+1 pattern can save seconds. Fix the big rocks first.
Don’t “cache everything” without a correctness plan
Caching can create subtle bugs (stale authorization, stale pricing, stale availability). If correctness matters, design invalidation as a first-class requirement.
When you should bring in help
If any of these are true, you usually benefit from a focused performance assessment:
- You have clear business impact (conversion, churn, SLA penalties) but unclear root cause.
- The system is legacy and risky to change, so you need safe, incremental optimization.
- Performance issues involve multiple layers (frontend, API, DB, cloud) and require cross-cutting fixes.
Wolf-Tech supports teams with code optimization, legacy code optimization, and full-stack modernization, typically starting with measurement, bottleneck mapping, and a prioritized remediation plan that fits your delivery constraints. If you want a second set of eyes on your slowest user journeys or endpoints, you can explore options at Wolf-Tech.