
Code Quality Metrics That Matter


Code quality is easy to talk about and surprisingly hard to measure. Most teams already track plenty of numbers (coverage, lint warnings, bugs, velocity), yet still feel the pain where it matters: slow changes, fragile releases, and “one more feature” turning into a week of archaeology.
The fix is not “more metrics.” It is choosing a small set of code quality metrics that predict outcomes (delivery speed, reliability, maintainability, security) and wiring them into everyday engineering decisions.
What “good” code quality metrics do (and what they should never do)
A useful metric changes behavior in the right direction. A harmful metric creates theater.
Good code quality metrics are:
- Actionable: If the number worsens, the team knows what to do next (refactor a hotspot, add tests around seams, shrink PR size).
- Comparable over time: You can see trendlines, not just snapshots.
- Cheap enough to collect continuously: Ideally automated in CI.
- Connected to risk: They highlight areas likely to create incidents, rework, or security exposure.
Metrics fail when they become targets. If leadership says “raise coverage to 90%,” teams can game it with low-value tests. If you measure “bugs per developer,” you discourage reporting and collaboration.
A better approach: treat metrics as decision support, not performance grading.
Start with the outcomes you care about
Before picking metrics, align on which outcome you are trying to protect.
- If you want faster feature delivery, you need maintainability and review-flow metrics.
- If you want fewer incidents, you need change risk and defect escape metrics.
- If you want lower long-term cost, you need hotspot and complexity metrics that guide refactoring.
- If you want better security posture, you need dependency and remediation metrics.
This is why teams often pair code-quality metrics with delivery and reliability measures such as DORA-style indicators (deploy frequency, lead time for changes, change failure rate, MTTR). Not because DORA is “the only way,” but because it keeps the conversation grounded in business impact.
Maintainability metrics that actually move the needle
Maintainability is where code quality becomes either an accelerator or a tax. The goal is not perfect elegance, it is predictable change at reasonable cost.
Complexity (use it to find refactoring candidates, not to shame developers)
Complexity metrics help you locate functions and modules that are hard to understand and risky to modify.
Common approaches:
- Cyclomatic complexity: Counts independent paths through code. Useful for flagging branching-heavy logic.
- Cognitive complexity: Tries to model how difficult code is to reason about (often better aligned with “this is hard to read” feedback).
How to use it well:
- Track the worst offenders (top N functions) rather than averages.
- Review complex code in the context of test coverage and churn. High complexity with high churn is a priority.
Code churn and “hotspots” (the most practical signal for risk)
Churn is how often code changes. Code that changes constantly is not automatically bad, but high churn combined with defects, incidents, or complexity often points to a brittle area.
A simple hotspot model many teams use:
- Frequency of changes (commits) in a file/module
- Lines changed (added + removed)
- Defects or incident links associated with the area
This is one of the best ways to prioritize modernization work because it answers: “Where will a refactor pay back fastest?” If you are actively modernizing legacy systems, hotspot-driven prioritization tends to outperform broad “rewrite the whole thing” initiatives. (Wolf-Tech’s legacy work often starts with this kind of targeting in a codebase assessment and remediation plan.)
Duplication (measure trendlines, not just current percentage)
Duplication is a maintainability multiplier. When logic is copied, you pay for every future change several times.
What matters most is:
- Are duplicate blocks increasing?
- Are duplicates concentrated in critical domains (pricing, permissions, billing)?
A practical rule: tolerate some duplication while a feature stabilizes, then consolidate once you understand the shape of the problem. Metrics should support that decision, not force premature abstraction.
Static analysis “maintainability” ratings (use as a conversation starter)
Tools like SonarQube and similar platforms can generate composite scores and “technical debt” estimates. These can be useful to spot patterns (null handling, resource leaks, overly complex methods), but treat the roll-up score as a smoke alarm, not a precision instrument.
Here is a quick map of maintainability metrics, how to collect them, and the most common misuses:
| Metric | What it tells you | How to collect | Common pitfall |
|---|---|---|---|
| Cyclomatic or cognitive complexity | Code that is hard to reason about and risky to change | Static analysis in CI | Chasing low complexity everywhere, even where code is stable |
| Code churn (by file/module) | Where change and rework concentrate | Git analytics | Confusing “busy code” with “bad code” without defect context |
| Hotspots (churn + complexity + incidents) | Best refactoring ROI areas | Git + static analysis + incident tagging | Not linking incidents back to code areas consistently |
| Duplication | Hidden future maintenance cost | Static analysis | Over-abstracting too early to satisfy the metric |
Test quality metrics (beyond “coverage %”)
Testing is a major lever for code quality, but the most reported metric (coverage) is also the easiest to misunderstand.
Coverage (use it as a risk map, not a target)
Coverage is still valuable when you treat it as where you lack a safety net.
Use coverage best by:
- Tracking coverage on changed code (diff coverage) so you protect new work.
- Looking at coverage specifically around hotspots and critical paths (auth, payments, data migrations).
Avoid turning it into a single goal like “80% everywhere.” Some code is better validated with integration tests, contract tests, or property-based tests, and coverage can under-represent those.
Flaky test rate (one of the most underrated delivery metrics)
Flaky tests destroy trust in CI, slow releases, and train engineers to rerun pipelines until they “go green.”
Flaky test metrics to track:
- Percentage of builds failing due to non-deterministic tests
- Top flaky tests by frequency
- Time to remediate flaky tests (treat it like reliability work)
This is a code quality metric because flaky tests are often symptoms of poor boundaries (too much global state, time dependence, brittle UI selectors, non-isolated integration environments).
Mutation testing score (high signal, higher effort)
Mutation testing changes your code in small ways (mutations) and checks whether tests fail. If tests still pass, they might not be asserting meaningful behavior.
Not every team needs mutation testing everywhere. Where it shines:
- Core business logic libraries
- Security-sensitive validation logic
- Complex calculations (finance, pricing, scheduling)
Test suite duration (quality also means “fast feedback”)
Long-running tests cause batching and big-bang merges, which increases risk. Track:
- Time from PR open to full CI signal
- Time to rerun a failed job
Often the best investment is splitting test layers (unit vs integration) and making integration environments reproducible.
Code review and collaboration metrics (quality is a team sport)
Some of the strongest “quality predictors” live in the pull request workflow because reviews are where design issues and maintainability concerns are caught early.
PR size
Smaller PRs are easier to review, test, and revert. You do not need a hard rule, but many teams find that reviewing hundreds of changed lines at once dramatically increases missed issues.
What to track:
- Median PR size (files changed, lines changed)
- Percentage of very large PRs (your “tail risk”)
If large PRs are common, the fix is usually process and architecture: vertical slicing, feature flags, incremental refactors, and better boundaries.
Review latency (time to first review, time to merge)
Long review cycles create merge conflicts, context switching, and rushed last-minute approvals. Review latency is a quality metric because it correlates with:
- Lower review depth
- Larger batch size
- More rework
A healthy target is not “as fast as possible,” it is “fast enough that the author is still in context.”
Rework rate
If PRs frequently bounce back with major changes, that can be a sign of:
- Unclear acceptance criteria
- Missing design alignment before coding
- Lack of shared conventions
This is a place where lightweight architecture notes and consistent code review standards pay off.

Defect and reliability metrics that tie code quality to real-world impact
Stakeholders ultimately experience quality as reliability. The most useful reliability-adjacent metrics are the ones that link changes to incidents.
Defect escape rate
This measures bugs found after release relative to bugs found before release.
Ways to implement it:
- Count production defects per release
- Or measure percent of total defects discovered in production
Pair it with severity. Ten cosmetic issues do not equal one critical outage.
Change failure rate
Change failure rate measures how often a change causes an incident, rollback, or urgent fix. This is one of the cleanest bridges between engineering activity and operational outcomes.
To make it actionable, link failures back to:
- Components (which module fails most)
- Patterns (migration failures, config errors, null handling)
- Missing test layers (no contract tests on an API boundary)
Mean time to restore (MTTR)
MTTR is not purely “code quality,” but code quality strongly influences it. Systems with:
- Clear module boundaries
- Good logging and tracing
- Feature flags
- Safe rollback paths
recover faster.
If MTTR is high, your “code quality work” might actually be observability and operability improvements.
Security-focused code quality metrics (the ones leaders understand)
Security metrics can get noisy fast. The goal is to measure exposure and remediation, not the raw count of findings.
Good starting metrics:
- Vulnerability age: How long known vulnerabilities remain unresolved in dependencies.
- Patch latency: Time from fix availability to production deployment.
- Secrets detection trend: Are credentials being committed less over time (and are they rotated)?
- High-risk area coverage: Tests and reviews around auth, permissions, input validation, and deserialization.
Security metrics work best when engineering and security agree on what “done” means (triaged, accepted risk, fixed and deployed, verified).
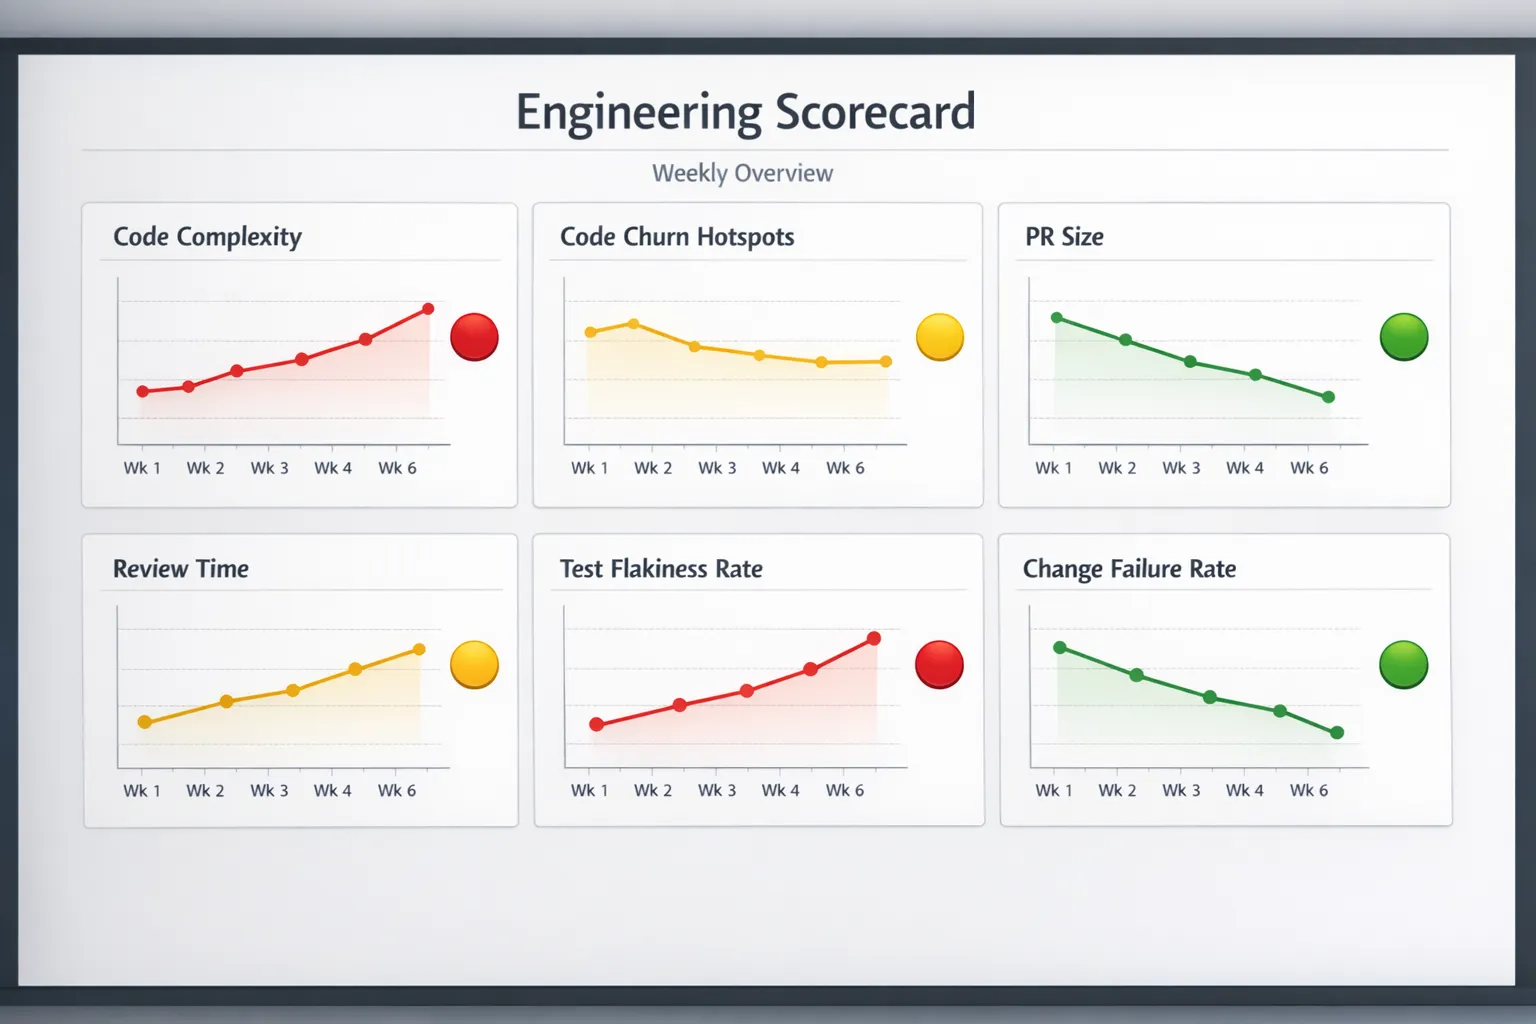
A lightweight “code quality scorecard” you can run weekly
If you want something that works across most stacks, start with a scorecard that mixes maintainability, test quality, and change risk.
| Category | Metric | Weekly question it answers | Suggested owner |
|---|---|---|---|
| Maintainability | Top hotspots (churn + complexity) | Where should we spend refactoring time next sprint? | Tech lead |
| Maintainability | Duplication trend | Are we copying logic more than we’re consolidating? | Team |
| Flow | Median PR size | Are we batching work too much? | Eng manager |
| Flow | Time to first review | Are reviews blocking delivery and increasing risk? | Team |
| Tests | Flaky test rate | Can we trust CI results? | Team |
| Tests | Diff coverage on changed code | Are we shipping changes without a safety net? | Tech lead |
| Reliability | Change failure rate | Are releases causing incidents? | Eng manager + SRE |
| Reliability | MTTR | How quickly can we recover when things go wrong? | SRE/Platform |
| Security | Vulnerability age (high severity) | Are we accumulating known exposure? | Security + team |
| Quality cost | Engineering time spent on rework | Are we paying an increasing “tax” to change code? | Eng manager |
You can keep the scorecard small and still be effective. The discipline is in the review cadence and follow-through, not in the number of charts.
Metrics that commonly backfire (and what to use instead)
Some metrics create perverse incentives or simply measure the wrong thing.
- Lines of code written: Rewards bloat, discourages deletion and simplification. Prefer hotspot reduction or lead time improvements.
- Story points completed: Easy to game, not portable across teams. Prefer outcome metrics (lead time, change failure rate) and product metrics.
- “Bugs per developer”: Punishes transparency and teamwork. Prefer defect escape rate by component and learning-oriented incident reviews.
- Raw coverage targets: Encourages low-value tests. Prefer diff coverage, flaky test rate, and coverage on critical domains.
A practical 30-day rollout plan
If you want code quality metrics to stick, implement them like a product: small scope, fast feedback, visible wins.
- Week 1: Pick 6 to 10 metrics, define them precisely (what counts, where data comes from), and decide who reviews them.
- Week 2: Automate collection in CI where possible (static analysis, test results, PR analytics). Create one shared dashboard.
- Week 3: Run the first review, identify one hotspot to address, and write down the hypothesis (for example, “refactor module X to reduce incident rate and review time”).
- Week 4: Ship one improvement and validate whether the metric moved in the expected direction.
A key habit: every time you add a metric, remove or de-emphasize another. Metric sprawl is real.
Where outside help can accelerate results
Sometimes the fastest path to better code quality is an outside, expert-led assessment that identifies the few changes with the highest ROI: reducing complexity in the highest-churn modules, introducing the right test seams, tightening CI feedback loops, and setting practical standards.
Wolf-Tech specializes in full-stack development and code quality consulting, including legacy code optimization and modernization planning. If you are already working through modernization work, you may also find these guides useful: code modernization techniques and refactoring legacy applications.
The main takeaway: measure what predicts pain, review it regularly, and let the data guide small, continuous improvements. That is how code quality stops being a vague aspiration and becomes a compounding advantage.