
Next.js Development: Performance Tuning Guide


Performance issues in a Next.js app rarely come from a single “slow” line of code. They are usually the result of small inefficiencies stacking up across rendering, data fetching, images, JavaScript execution, third party scripts, and infrastructure. The good news is that Next.js gives you strong primitives for fixing each layer, as long as you approach tuning as a measurement-driven workflow.
This guide focuses on practical performance tuning for real-world Next.js development: how to identify the bottleneck, which levers move Core Web Vitals, and how to prevent regressions once you improve things.
Start with what “fast” means (and pick targets)
If you do not define success, you cannot tune reliably. For most product teams, success is a combination of user-perceived speed and operational cost.
Google’s Core Web Vitals are a pragmatic baseline because they correlate strongly with perceived performance:
- LCP (Largest Contentful Paint): how quickly the main content becomes visible
- CLS (Cumulative Layout Shift): visual stability
- INP (Interaction to Next Paint): responsiveness under real interaction
Google’s reference thresholds are the most common starting point. You can review the current definitions and guidance on web.dev/vitals.
| Metric | “Good” target (commonly used) | What it usually reflects in Next.js apps |
|---|---|---|
| LCP | ≤ 2.5s | TTFB, image optimization, CSS/fonts, above-the-fold rendering |
| CLS | ≤ 0.1 | image sizing, late-loading UI, font swapping, layout thrash |
| INP | ≤ 200ms | JS bundle size, hydration cost, expensive event handlers, third-party scripts |
| TTFB (not a CWV, but critical) | ≤ 0.8s (rule of thumb) | server render time, cold starts, cache misses, slow APIs/DB |
Two important clarifications:
- Lab scores are not user experience. Lighthouse is useful, but it is a synthetic run on a specific machine/network profile.
- You need both field and lab data. Field data tells you what real users feel, lab data tells you where to dig.
Build a measurement baseline (before you touch code)
Use field metrics (RUM) to avoid “optimizing the wrong thing”
Real User Monitoring (RUM) answers: “Which routes are slow for actual users, on actual devices?”
At a minimum, capture:
- Route/path
- LCP, CLS, INP
- TTFB (or server timing data)
- Device class (mobile/desktop), network hints if available
- Release/version (so you can detect regressions)
If you want to implement this quickly, the web-vitals library provides the raw metrics, and you can forward them to your own endpoint.
Use lab tools to pinpoint the bottleneck
For diagnosis, you want repeatable, actionable traces:
- Chrome DevTools Performance panel: main-thread work, long tasks, layout thrash
- Lighthouse: quick checks, CI friendly, good for regressions
- WebPageTest: waterfall-level detail, great for TTFB vs asset loading
- React DevTools Profiler: component re-render cost
A simple but effective practice is to run a “golden” test on the 3 to 5 most important routes and keep those profiles as references.
A practical tuning workflow for Next.js
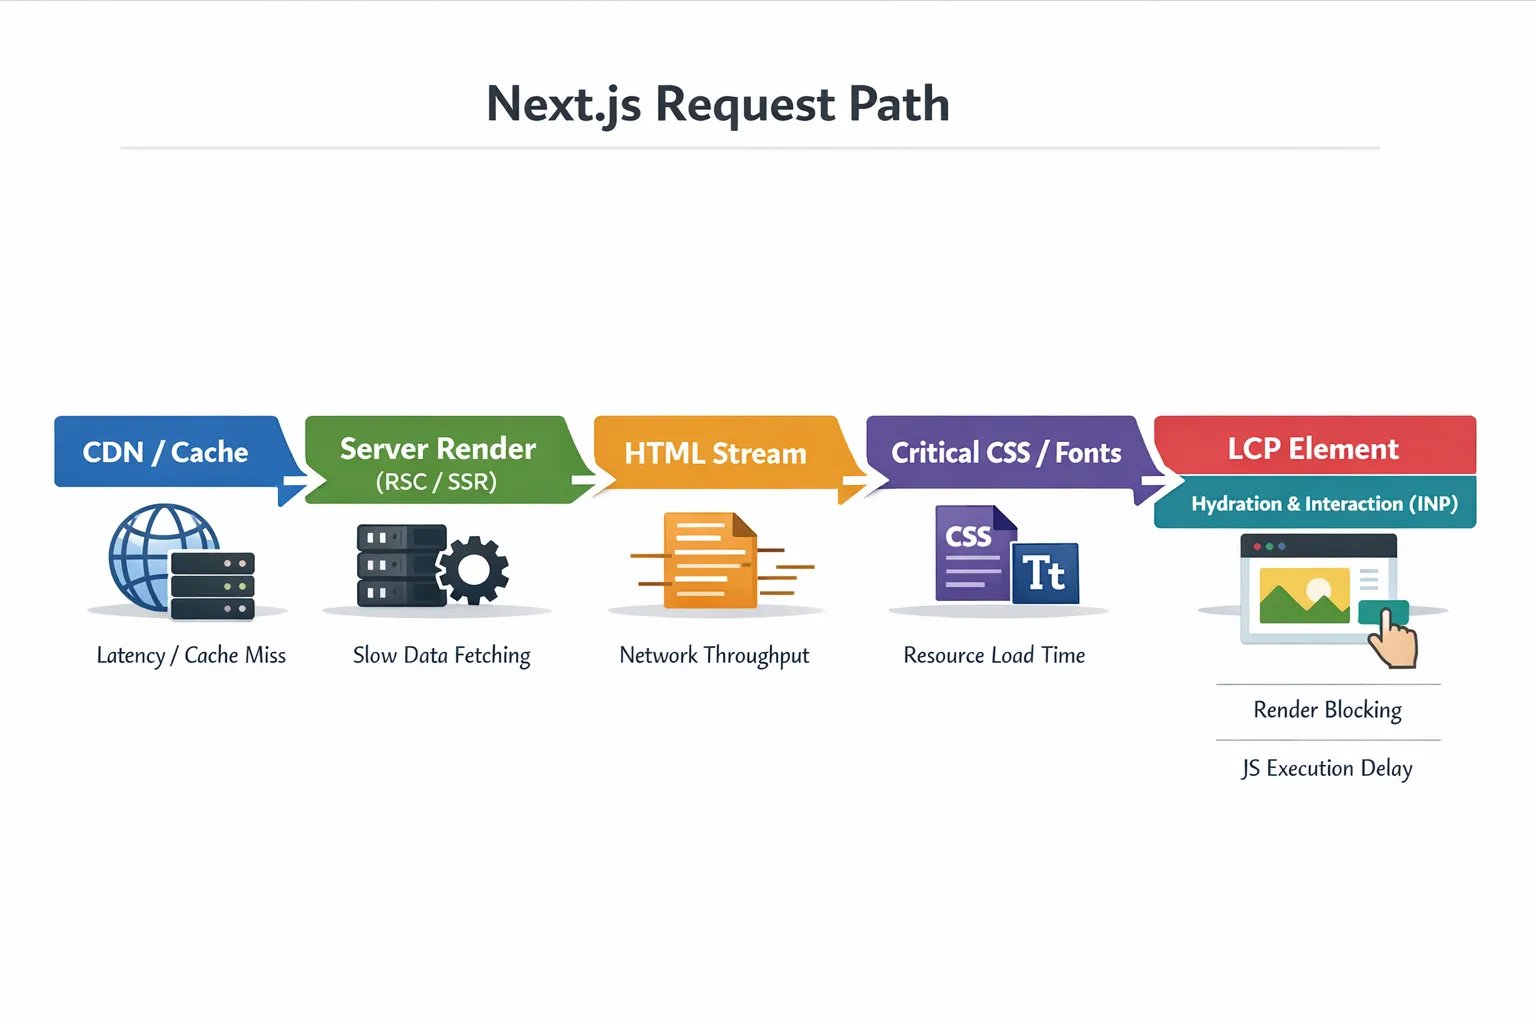
1) Determine which phase is slow: server, network, or browser
Most Next.js performance problems show up as one of these patterns:
| Symptom | How to confirm | Typical causes | High-leverage fixes |
|---|---|---|---|
| High TTFB | WebPageTest waterfall, server logs | cache misses, slow DB/API, heavy SSR, cold starts | caching, reduce server work, optimize queries, move work off request path |
| LCP slow but TTFB OK | Lighthouse, filmstrip | large hero image, render blocking CSS, fonts | optimize images/fonts, reduce critical CSS, preload right assets |
| INP poor | RUM + DevTools long tasks | too much client JS, heavy hydration, third-party scripts | shrink client bundles, defer scripts, reduce re-renders |
| CLS poor | Lighthouse + layout shift regions | missing image dimensions, late UI insertion, font swapping | set sizes/aspect-ratio, stable skeletons, font strategy |
Make this decision first. If you guess, you will often “fix” something that does not move your real metrics.
2) Reduce client-side JavaScript (usually the biggest INP win)
In modern Next.js, the most consistent performance gains come from shipping less JavaScript and doing less work on the main thread.
Common causes of excessive client JS:
- Too many components marked with
"use client" - Heavy UI libraries loaded on every route
- Large JSON payloads passed to the client
- Third-party analytics, chat widgets, A/B testing scripts
Practical tuning moves:
- Keep client components thin, push data shaping and formatting to the server.
- Split non-critical UI via dynamic import. Example for a heavy editor or chart:
import dynamic from "next/dynamic";

const Chart = dynamic(() => import("./Chart"), {
  ssr: false,
  loading: () => <div style={{ minHeight: 240 }} />,
});
- Audit route-level bundles. Look for “always loaded” dependencies that could be moved behind route boundaries.
- Avoid sending large objects to the client. If you only need 5 fields, do not serialize 50.
If you want a deeper companion read on React-side patterns that reduce re-render work, see Wolf-Tech’s guide on React patterns for enterprise UIs.
3) Fix LCP by treating the hero path as a product feature
LCP is often decided by a small set of assets and layout decisions above the fold.
High-impact checks that are easy to miss:
- Your LCP element is frequently the hero image, headline, or a large banner component.
- If the hero is an image, ensure you are using
next/imagecorrectly. - Make sure width/height (or an aspect ratio strategy) is stable so the browser can allocate space early.
Here is a practical mental model: everything that blocks first meaningful paint is part of your “critical rendering path”. Make it intentionally small.
4) Stop layout shifts at the source (CLS)
CLS improvements are often straightforward once you identify the shifting element.
Common fixes in Next.js projects:
- Always reserve space for images and embeds (explicit dimensions or stable aspect ratio containers).
- Avoid injecting banners/tooltips at the top of the page after load. If you must, reserve a slot.
- Be careful with font swapping. Use Next.js font tooling where possible and avoid late font loads that reflow large text blocks.
5) Make data fetching predictable: cache, dedupe, and remove waterfalls
Slow pages are frequently “fast UI, slow data.” The biggest performance shift happens when you eliminate cache misses and request waterfalls.
Practical tactics:
- Eliminate waterfalls: if you fetch A then fetch B, but B depends on A only for an ID you already have, refactor. Parallelize what you can.
- Cache stable data: product catalogs, navigation, permissions, and feature flags often do not need per-request computation.
- Move expensive aggregation off the request path: precompute, denormalize, or cache computed views.
This overlaps with architectural best practices, but the tuning mindset is different: you are not choosing a rendering strategy in theory, you are looking at the route’s measured TTFB and cache hit rate and making it boring and repeatable.
For a broader scalability-oriented view (rendering strategy choices, caching patterns, and operational defaults), Wolf-Tech’s Next.js best practices for scalable apps is a useful complement.
6) Treat third-party scripts as performance debt (because they are)
Third-party scripts can dominate INP and delay LCP. Even “small” tags often add:
- extra network connections
- long main-thread tasks
- layout shifts from injected UI
In Next.js, load third-party scripts intentionally (not “just paste it in the layout”) and verify:
- Does it need to run before interactivity?
- Can it load after user interaction?
- Can you scope it to specific routes?
Next.js provides next/script with different loading strategies. The right choice depends on what the script does, but the tuning principle is universal: do not let third parties execute on the critical path by default.
Server and infrastructure tuning that moves TTFB
Client-side optimization can only take you so far if your server path is slow or inconsistent.
Reduce cold starts and runtime overhead
If you see a “spiky” TTFB distribution, where p50 is fine but p95 is bad, you often have one of these:
- cold starts
- uneven cache hit rates
- noisy neighbor resource contention
- slow external dependencies
Fixes depend on hosting and architecture, but they generally fall into:
- increasing cache hit rate (full-page, data-level, or CDN)
- removing heavy work from the request path
- tuning infra capacity and concurrency
This is where a mature DevOps and SRE practice pays off.
Optimize the backend path (DB and APIs)
If the server render waits on slow APIs or queries, your Next.js app will look “slow” no matter how optimized the UI is.
High-leverage backend fixes that routinely improve Next.js TTFB:
- Add the missing index for a top query.
- Remove N+1 query patterns in your API layer.
- Cache expensive joins/aggregations.
- Use timeouts, retries, and circuit breakers so a degraded dependency does not drag every page.
If you want a reliability-focused playbook that pairs well with performance work (because slow is often a form of failure), Wolf-Tech’s backend reliability best practices is a solid reference.
Make performance improvements stick (CI, budgets, and guardrails)
The fastest teams are not the ones that do one heroic performance sprint. They are the ones that prevent performance from degrading as the product grows.
Add performance budgets that match user experience
Budgets should connect to user impact, not vanity numbers. Examples that work well:
| Budget type | Example threshold | Why it prevents regressions |
|---|---|---|
| Route-level LCP | Must not exceed baseline by > 10% | Captures real UX degradation |
| Client JS per route | Keep under an agreed limit | Prevents hydration and INP from creeping |
| Long tasks | No long task over 200ms in key flows | Directly improves responsiveness |
| Image weight above the fold | Hero image under a set size | Prevents LCP regressions |
You can enforce budgets in CI using Lighthouse (or Lighthouse CI) for a small set of critical routes, then validate with RUM in production.
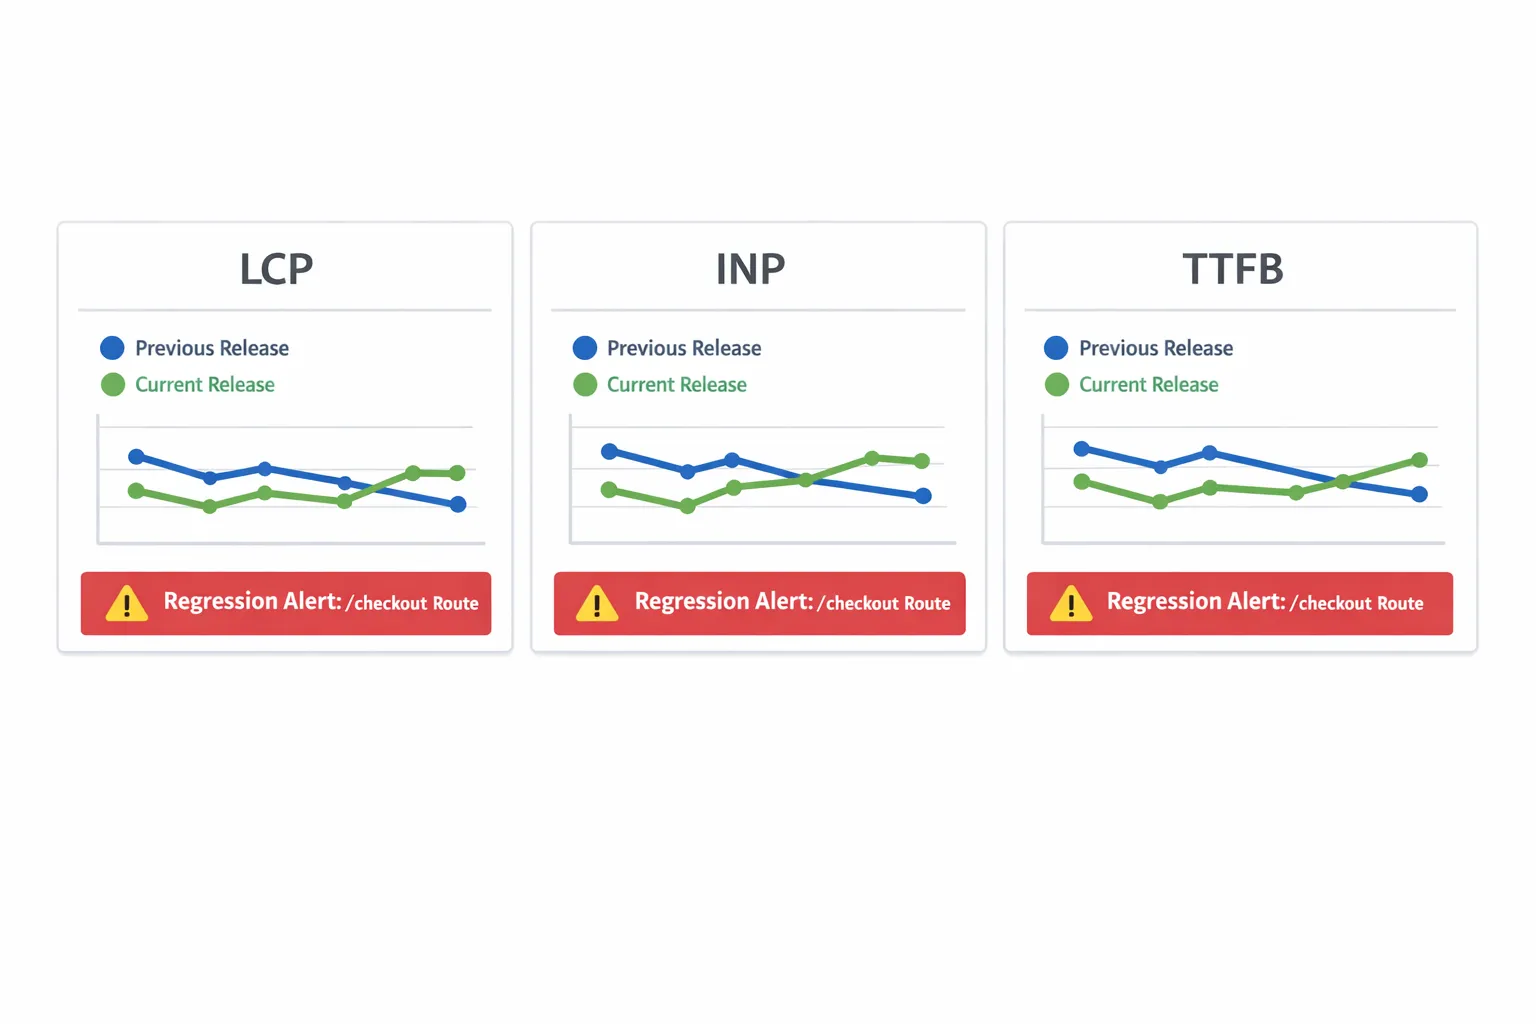
Instrument releases with “before vs after” comparisons
A practical approach:
- Tag RUM metrics with a build SHA or version.
- Compare p75 metrics for key routes between releases.
- Alert on sustained regression, not single spikes.
This is how performance tuning becomes an operating capability, not a one-off task.
When to bring in expert help
If you are stuck after basic tuning, it is usually because the bottleneck sits at a boundary:
- a route that flips between static and dynamic unexpectedly
- a backend dependency that is intermittently slow
- a client bundle that looks small until you factor in third-party scripts
- a caching strategy that is correct, but not producing consistent hit rates
Wolf-Tech can help by running a structured performance audit (RUM plus lab profiling), identifying the specific bottleneck per key route, and shipping fixes that improve Core Web Vitals without destabilizing your architecture. If you are already scaling a Next.js codebase, pairing this with a code quality and delivery review often yields the fastest overall gains.
If you want to turn this into a repeatable plan, start by selecting your top 3 user journeys, collecting one week of field metrics, then do a targeted tuning sprint focused on the biggest bottleneck category (TTFB, LCP, INP, or CLS). Performance tuning is most effective when you treat it as a loop: measure, change one variable, verify, and lock it in with guardrails.