
React Website Performance: Fix LCP, CLS, and TTFB


If your React website feels “fine on my machine” but users see jank, slow hero rendering, or flaky Lighthouse scores, you are usually fighting three different problems with one vague label: “performance.” The fastest way to make progress is to separate them:
- LCP (Largest Contentful Paint): how quickly the main content becomes visible.
- CLS (Cumulative Layout Shift): how stable the page is while it loads.
- TTFB (Time to First Byte): how quickly the server (and network) start responding.
Google’s guidance on Core Web Vitals is explicit about thresholds and measurement: prioritize field data, then use lab tools to reproduce and debug issues (web.dev on Core Web Vitals). This article gives a practical, React-specific playbook to diagnose and fix each metric without cargo-cult tuning.
What LCP, CLS, and TTFB actually measure (and why React teams confuse them)
React apps often blur boundaries between “server slow,” “frontend slow,” and “data slow” because rendering frequently depends on JavaScript and API calls. Start by aligning on the definitions.
| Metric | What it measures | “Good” target (Google) | Common React website causes |
|---|---|---|---|
| LCP | When the largest element in the viewport becomes visible | ≤ 2.5s | Heavy hero images, render blocking CSS/JS, hydration cost, data fetching waterfalls |
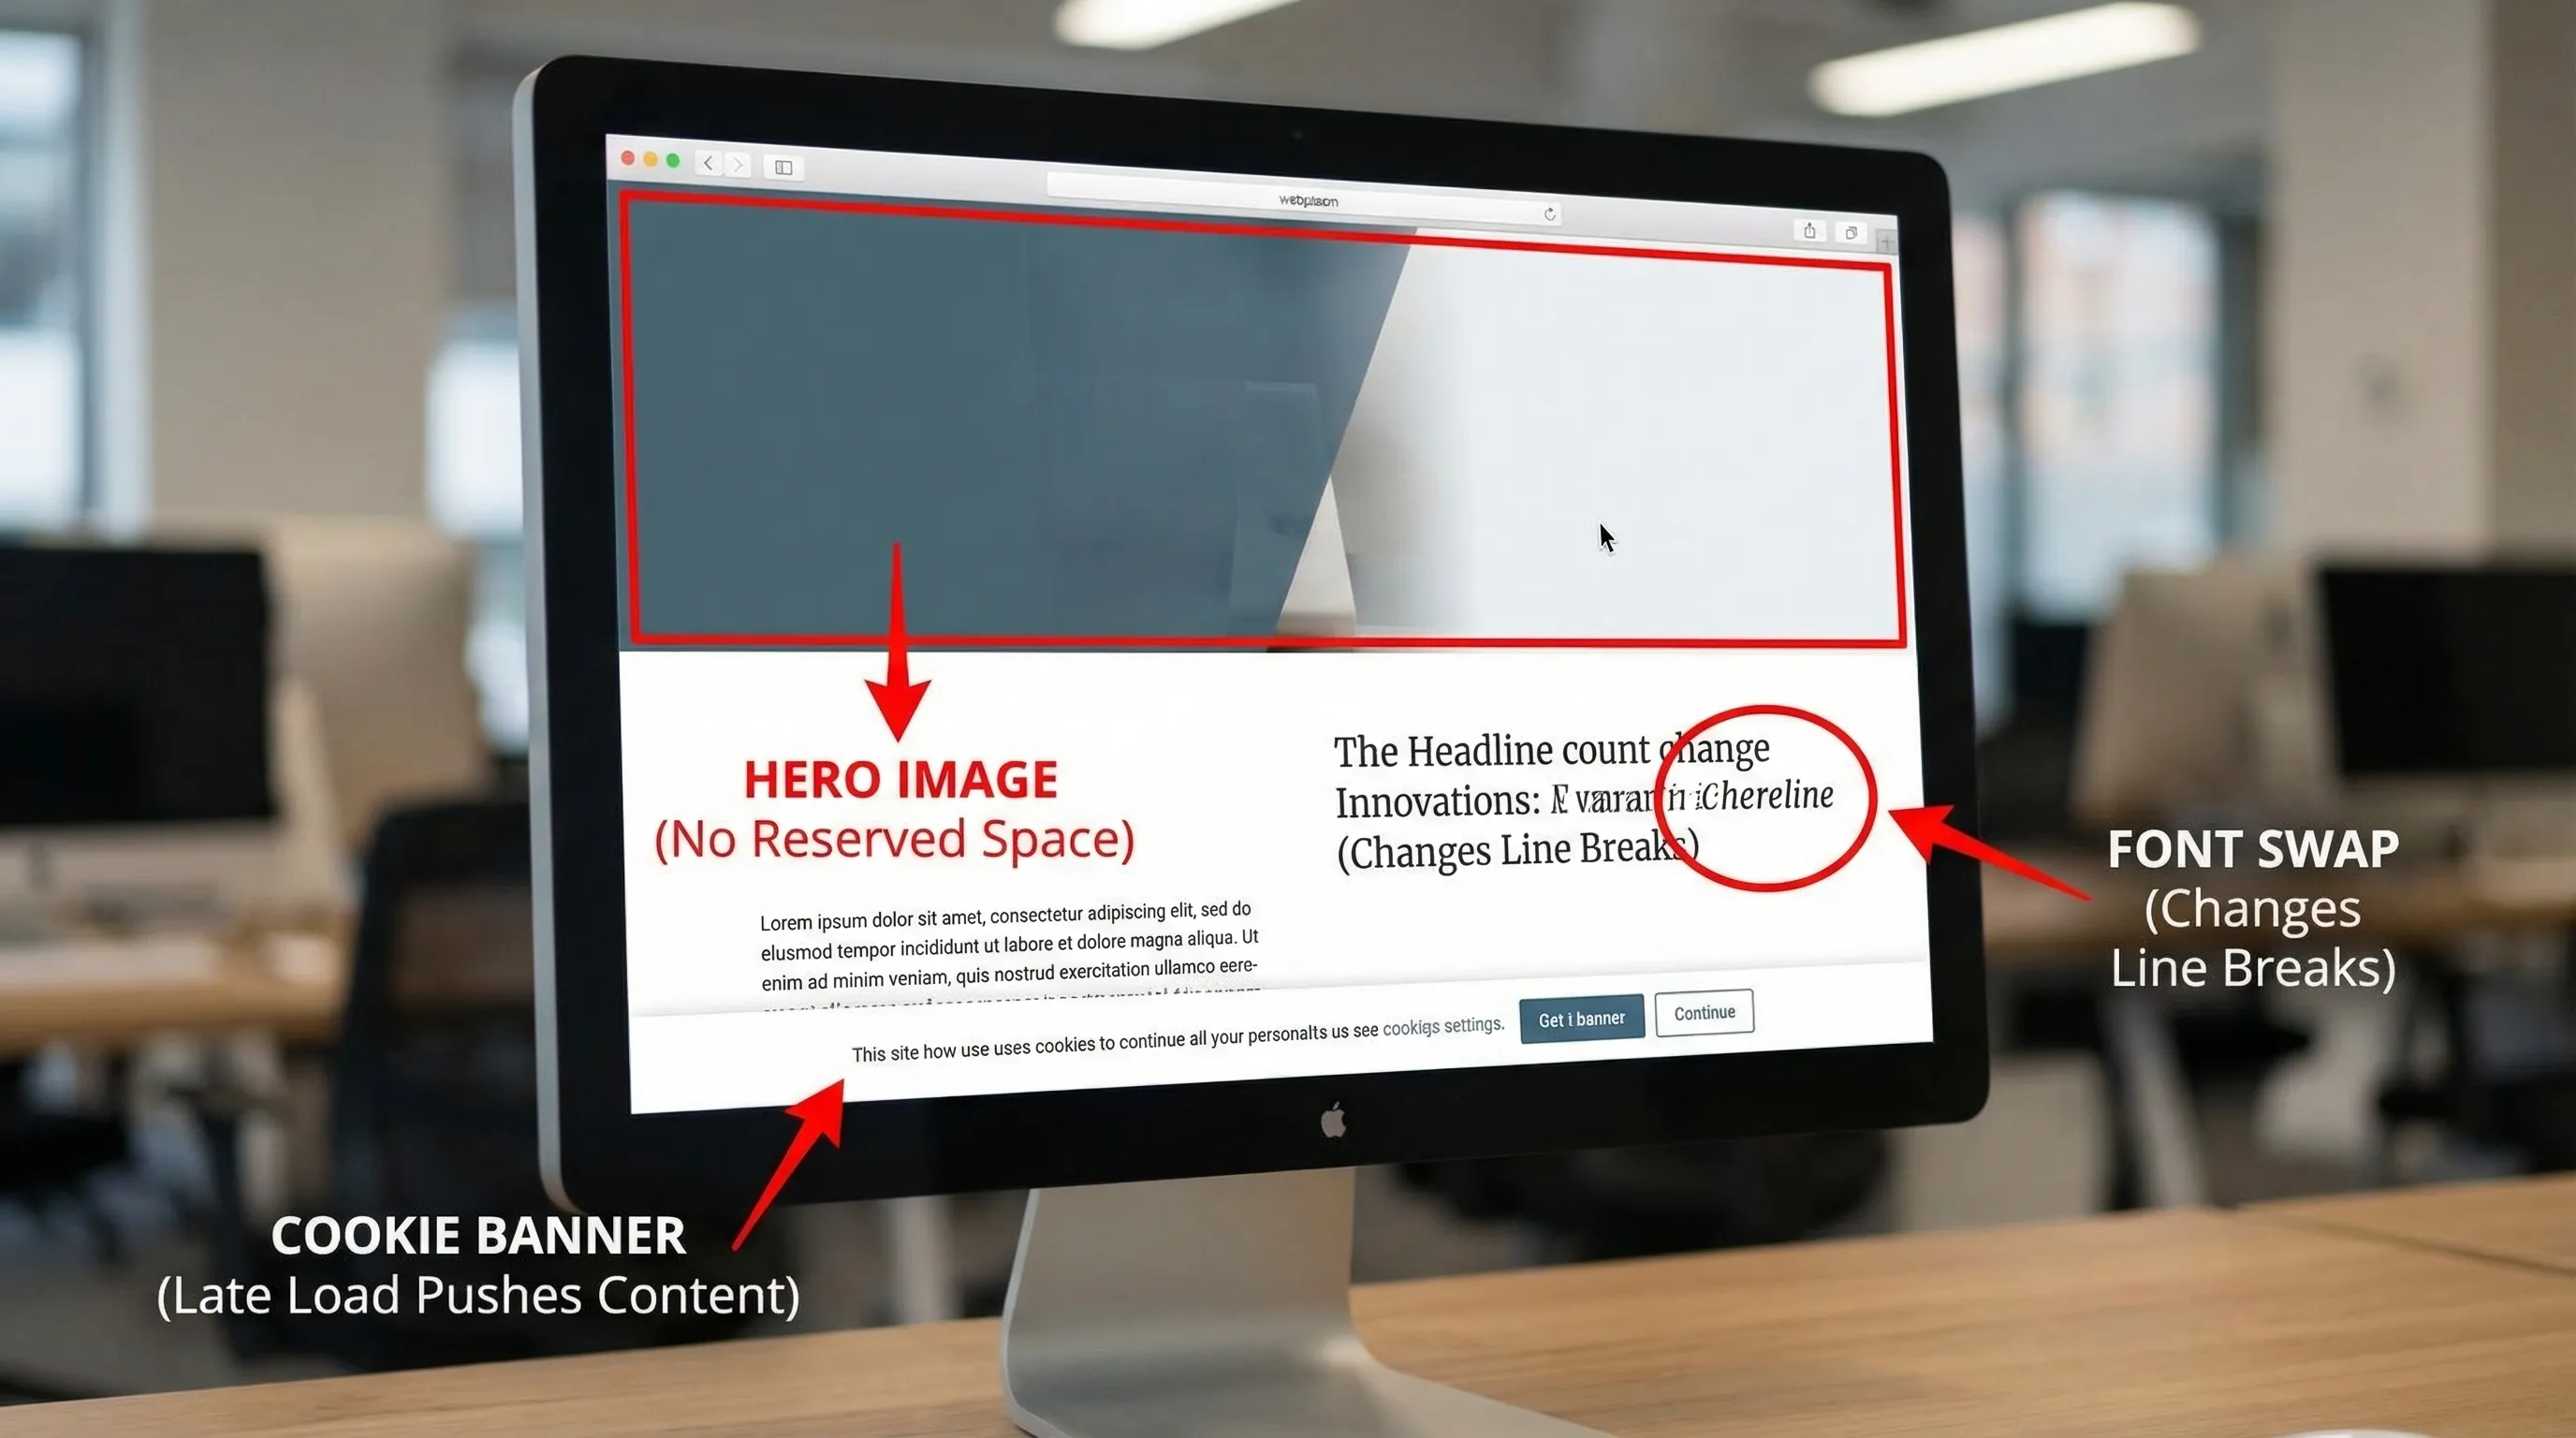
| CLS | Visual stability, unexpected layout movement | ≤ 0.1 | Images without dimensions, late-loading banners, font swaps, skeletons that change height |
| TTFB | Time until first byte of HTML is received | ≤ 0.8s (good), slower needs attention | No CDN caching, slow SSR/data queries, cold starts, too many redirects |
Two important clarifications:
- TTFB is not “React is slow.” If your HTML arrives quickly but the page is blank until JS loads and data returns, that is typically LCP and main-thread work, not TTFB.
- CLS is rarely a single bug. It is usually many small “unreserved space” issues across images, components, and late UI.
Step 1: Measure the right way (field first, lab second)
Performance work becomes political when you cannot agree on the baseline. Use a simple measurement stack that produces answers like “p75 LCP on product detail pages in the US on mobile.”
Field data (what users experience)
Use at least one of these:
- Chrome UX Report (CrUX) via PageSpeed Insights or BigQuery for real-user Core Web Vitals where available (CrUX docs).
- RUM (Real User Monitoring), either from your observability vendor or via your own beaconing.
- The lightweight
web-vitalslibrary to capture LCP, CLS, and INP in production (GitHub: web-vitals).
A minimal “don’t overthink it” instrumentation example:
import { onCLS, onLCP, onTTFB } from 'web-vitals'

function sendToAnalytics(metric: { name: string; value: number; id: string }) {
  navigator.sendBeacon(
    '/rum',
    JSON.stringify({
      name: metric.name,
      value: metric.value,
      id: metric.id,
      path: location.pathname,
    })
  )
}

onCLS(sendToAnalytics)
onLCP(sendToAnalytics)
onTTFB(sendToAnalytics)
If you do one thing, do this: tag metrics by route/template (home, category, detail, checkout, marketing landing). Averages hide the pages that matter.
Lab data (to reproduce and debug)
- Lighthouse and PageSpeed Insights for repeatable audits.
- Chrome DevTools Performance panel to see main-thread work, layout shifts, long tasks, and the LCP element.
- React Profiler for component-level render cost.
Lab data is not truth, but it is the fastest way to locate the actual cause once field data tells you which page is failing.

Step 2: Fix LCP in a React website (treat the hero path as a product feature)
LCP is usually “the biggest thing users care about” on that page: hero image, product photo, headline block, or a large card.
Find your LCP element and why it is late
In Chrome DevTools (Performance or Lighthouse details) you can see the LCP element and its timing breakdown. Common patterns:
- The LCP element is an image that loads too slowly.
- The LCP element is text delayed by fonts, CSS, or JS.
- The LCP element depends on data that arrives after one or more client-side waterfalls.
High-impact LCP fixes (React-specific)
1) Make the LCP resource load earlier (usually images)
If the LCP is an image, your first goal is to ensure the browser discovers it immediately and downloads an appropriately sized file.
- Use responsive images (
srcset,sizes) so mobile does not download desktop assets. - Prefer modern formats (AVIF/WebP) where your pipeline supports them.
- Avoid shipping the hero image only after client-side routing state resolves.
- Preload the hero image when it is known at build time.
If your stack supports SSR/SSG, ensure the hero image URL is present in the initial HTML so discovery does not depend on hydration.
2) Reduce render-blocking work before the hero can paint
React websites often delay LCP because too much JavaScript must execute before meaningful content appears.
Practical tactics that work across SPA and SSR setups:
- Route-level code splitting using
React.lazy()and dynamic imports, so your marketing route does not download your entire app. - Remove or defer non-critical scripts (analytics, chat widgets) until after the first paint.
- Audit dependencies that inflate bundles (date libraries, editor toolkits, charting libs) and isolate them to the routes that need them.
Bundle analysis is frequently the fastest win. Most build tools can visualize chunk composition.
3) Prevent data-fetching waterfalls on the critical path
A common LCP killer in React is “render, then fetch, then render again, then fetch more.” This tends to happen when:
- Components fetch their own data independently.
- Auth/session checks block page data.
- The API shape forces multiple sequential calls.
Fixes:
- Fetch critical data at the route boundary, not deep in the tree.
- Parallelize independent calls.
- Add a BFF (Backend for Frontend) or aggregation endpoint when the UI needs a single view model.
- Cache server responses aggressively for public content.
If you want a broader architecture framing for React teams, Wolf-Tech’s guide on seams, state types, and boundaries helps prevent these performance traps: React Front End Architecture for Product Teams.
4) Fonts: make text paint fast and predictably
When LCP is a large heading, font loading can delay it.
- Preconnect to font origins if using a font CDN.
- Use
font-display: swapso text renders promptly. - If you see layout shifts due to font swapping, address that under CLS (below) with font metric overrides.
Google’s general guidance on optimizing LCP emphasizes prioritizing critical resources and reducing render-blocking work (Optimize LCP).
Step 3: Fix CLS (stability is a design and engineering contract)
CLS is frequently underestimated because the page “looks fine” to developers on fast connections. In the field, users see late banners, resizing images, and UI that jumps when data arrives.
The CLS root causes you should check first
1) Images and media without reserved space
If any content loads later into a box that had no explicit size, the browser must reflow the page.
- Always provide
widthandheighton images, or use CSSaspect-ratio. - For responsive layouts, reserve space using a container with a fixed aspect ratio.
- Treat embeds (iframes, videos) the same way.
2) Skeletons and placeholders that do not match final layout
Skeleton UIs are great, until the skeleton height differs from the final content.
- Use stable placeholders that match the final component dimensions.
- Avoid “loading spinners” that collapse a section and then expand it.
3) Late UI inserted above existing content
Common offenders:
- Cookie consent bars that push content down.
- Promo banners injected after hydration.
- Form validation summaries that appear at the top after submission.
Prefer overlays for late UI, or reserve space for banners from the start.
4) Font swaps causing layout shift
Even with font-display: swap, swapping to a web font can change text width and line breaks.
Mitigations:
- Use fallback fonts with similar metrics.
- Consider
size-adjust,ascent-override,descent-override, andline-gap-overridein@font-faceto align metrics and reduce shift.
Reference: web.dev on preventing layout shifts.
A practical CLS checklist you can hand to a team
- Ensure all images, iframes, and video containers reserve space.
- Reserve space (or use overlays) for banners and consent UI.
- Make skeletons dimensionally consistent with final components.
- Avoid inserting content above the fold after initial render.
- Use transform-based animations (
transform,opacity), not layout-changing animations (top,height).
Step 4: Fix TTFB (separate caching problems from backend latency)
TTFB is a server and delivery metric. For a React website, it depends on whether you serve static HTML, SSR, or an app shell.
Diagnose TTFB with a simple breakdown
When TTFB is high, it is usually one of these:
- Too far from the user (no CDN, wrong region, no edge caching).
- Too much server work per request (SSR doing heavy work, slow APIs, slow database queries).
- Cold starts (serverless functions waking up, new containers).
- Redirect chains (http to https, www to apex, locale redirects).
Before changing code, confirm the bottleneck:
- Use server timing headers (
Server-Timing) to surface SSR time, DB time, cache hit or miss. - Use tracing (OpenTelemetry, APM vendor) to pinpoint where the request spends time.
High-leverage TTFB fixes
1) Cache the HTML (or avoid generating it per request)
If your “website” pages are mostly public and content-driven, pushing them toward static generation or cached SSR usually yields the biggest TTFB improvements.
- Put a CDN in front of the origin.
- Use cache headers that enable edge caching.
- Ensure personalized content does not accidentally disable caching for everyone.
2) Remove server-side waterfalls
If SSR waits on multiple backend calls, TTFB grows with each dependency.
- Parallelize server-side fetches.
- Add aggregation endpoints for page-level view models.
- Cache expensive computations.
3) Fix backend hot paths (database and APIs)
TTFB is often a symptom of slow data access.
- Identify slow queries, add the right indexes, and eliminate N+1 patterns.
- Use connection pooling appropriately.
- Move non-critical work off the request path.
If you want a broader “system-level” optimization mindset (beyond micro-tuning), this Wolf-Tech article is a good companion: Optimize the Code: High-Impact Fixes Beyond Micro-Optimizing.
4) Eliminate redirect chains
Redirects are easy to miss and expensive on mobile.
- Collapse multiple redirects into one.
- Fix canonical host and protocol at the edge.
Step 5: Prevent regressions with budgets and guardrails
A one-time performance sprint helps, but performance decays unless you make it part of delivery.
Add performance budgets that match your business
You do not need an elaborate system. Start with budgets tied to what you already measure:
| Guardrail | What it prevents | How to enforce |
|---|---|---|
| LCP and CLS thresholds per key route | Slow hero path, layout instability | RUM alerts, weekly p75 review |
| Bundle size checks | “Just one more dependency” growth | CI step, bundle analyzer in PR |
| Third-party script policy | Tag sprawl | Require review, load after interaction |
| Synthetic checks for top pages | Silent breakages | Scheduled Lighthouse runs |
Make performance ownership explicit
The most reliable pattern is to treat performance as a cross-functional contract:
- Product defines which routes are revenue-critical.
- Design commits to stable layout patterns.
- Engineering commits to budgets and enforcement.
- Ops commits to caching and latency SLOs.
Wolf-Tech’s approach to “testable proofs” in front-end delivery aligns well with performance work, because it makes budgets and evidence part of the definition of done: Front End Development Services: Deliverables That Matter.
A pragmatic 10-day plan to improve a React website
If you want momentum without turning this into a quarter-long initiative:
Days 1 to 2: Baseline and pick target routes
Focus on 2 to 4 templates that drive conversions or acquisition.
Days 3 to 6: Fix the biggest LCP and CLS issues per route
LCP and CLS improvements usually ship in small, reviewable changes: image sizing, preloads, removing a blocking script, reserving layout space.
Days 7 to 8: TTFB and caching pass
Add server timing, fix redirects, validate CDN behavior, and tackle the slowest SSR or API path.
Days 9 to 10: Add guardrails
Introduce budgets, CI checks, and basic RUM alerting so you do not lose the gains.
When you should bring in an outside performance review
Consider an external audit when:
- Field data shows persistent p75 failures and you cannot reproduce reliably.
- You have a mixed rendering setup (SPA plus SSR) and ownership is unclear.
- Third-party scripts are politically hard to control.
- Backend latency and frontend rendering are both suspects.
Wolf-Tech helps teams build, optimize, and scale production React and full-stack systems, including performance-focused reviews and modernization work. If you want a measurement-first plan that targets LCP, CLS, and TTFB with clear proof and regression guardrails, start at Wolf-Tech and we can scope a short, high-signal engagement.