
Optimize the Code: High-Impact Fixes Beyond Micro-Optimizing


Most teams don’t have a “slow code” problem. They have a misallocated effort problem.
Engineers spend days shaving milliseconds off tight loops while the real bottleneck is a chatty database, a single unindexed query, a third-party call in the request path, or a payload that is simply too big. If your goal is to optimize the code in a way that users and the business can feel, you need to focus on fixes that change the shape of the system, not just the syntax.
This guide is about high-impact optimization: the changes that move p95 latency, error rates, and infrastructure cost meaningfully, without turning your codebase into an unreadable science project.
Why micro-optimizing rarely moves the needle
Micro-optimizations (small code changes that speed up a single function) can be valuable, but they are usually the wrong first move because:
- Most production latency is I/O-bound, not CPU-bound. Network, database, disk, serialization, and queueing dominate.
- Amdahl’s law applies: speeding up a part of the system that only contributes 5 percent of the total time can never produce a big overall win. (See Amdahl’s law.)
- Complexity is a performance tax. Clever code can be faster locally, but slower globally because it increases bugs, review time, and regression risk.
- Without measurement you optimize the wrong thing. The “obvious” bottleneck is often not the real one.
If you want a broad catalog of optimization techniques across frontend, backend, and data layers, Wolf-Tech also has a companion guide: Code Optimization Techniques to Speed Up Apps. This article goes one level up: how to pick the fixes that matter most.
Start with a performance target that’s tied to outcomes
“Make it faster” is not a requirement. Before touching code, define what you are optimizing for.
Examples of targets that create clarity:
- Checkout API: p95 under 250 ms for authenticated users in region X
- Search: p95 under 800 ms, p99 under 2 s, error rate under 0.1%
- Web app: improve Core Web Vitals (LCP, INP, CLS) on key landing pages
- Cost: reduce compute spend by 20 percent without changing functionality
Performance work becomes high leverage only when you can answer:
- Which user journeys matter most?
- Which percentile matters? (p50 rarely reflects pain. p95 and p99 often do.)
- What is the acceptable trade-off? (Consistency vs freshness, latency vs cost, etc.)
If you do not already track reliability and latency in a disciplined way, set a baseline using your existing observability stack and align on SLOs. Wolf-Tech’s approach to measurable operability shows up in several engineering guides, including Backend Development Best Practices for Reliability.
Find the bottleneck with evidence (not instincts)
High-impact optimization is a loop:
- Measure real behavior (production, or a faithful staging environment).
- Identify the dominant contributors.
- Apply the smallest change that removes the biggest contributor.
- Re-measure and add guardrails.
The key is using the right tool for the question:
- Distributed tracing to see where time is spent across services and dependencies.
- Database query metrics (slow query logs, query plans, lock time, index usage).
- Profiling (CPU, memory, lock contention) when you suspect compute or runtime overhead.
- Frontend field data for real user experience, not just lab Lighthouse scores.
A quick “where is it slow?” triage
Use symptoms to choose the first investigation step.
| Symptom you observe | Likely bottleneck category | Best first evidence to collect | High-impact fix family |
|---|---|---|---|
| p95 is high, p50 is fine | Queueing, contention, spikes | Traces by percentile, saturation metrics | Backpressure, pooling, concurrency limits, isolation |
| Latency correlates with traffic | Capacity or DB saturation | CPU, DB connections, locks, request rate | Indexing, caching, read replicas, autoscaling |
| Single endpoint is slow | Hot path logic or query | Trace spans, endpoint profiling, query plan | Remove work, fix query shape, batching |
| Requests are fast but users complain | Frontend bottleneck | Web Vitals, JS bundle, waterfall | Reduce JS, optimize LCP, defer third-party |
| CPU is high but throughput is low | Inefficient compute or GC | CPU profile, heap profile, GC logs | Algorithm/data structure changes, allocation reduction |
High-impact fixes that beat micro-optimizations
Most meaningful wins come from one of five moves:
- Remove work.
- Reduce round trips.
- Make data access predictable.
- Move work off the critical path.
- Prevent regressions.
Let’s break these down with concrete examples.
1) Remove work from the hot path
The fastest code is the code you do not run.
Look for “hidden work” that accumulates:
- Recomputing derived values on every request
- Doing heavy authorization checks repeatedly instead of once per request
- Fetching data that the caller does not use
- Rendering UI that is never visible above the fold
- Running expensive validations in synchronous paths that could be async
Practical patterns:
- Early exits: fail fast on invalid states before hitting the database.
- Avoid duplicate parsing/serialization: parse once, pass structured data through.
- Reduce feature scope in hot endpoints: keep the critical user journey lean.
This is also where code quality pays performance dividends. If your hot path is hard to reason about, it is hard to optimize safely. For a metrics-driven view of what to improve first, see Code Quality Metrics That Matter.
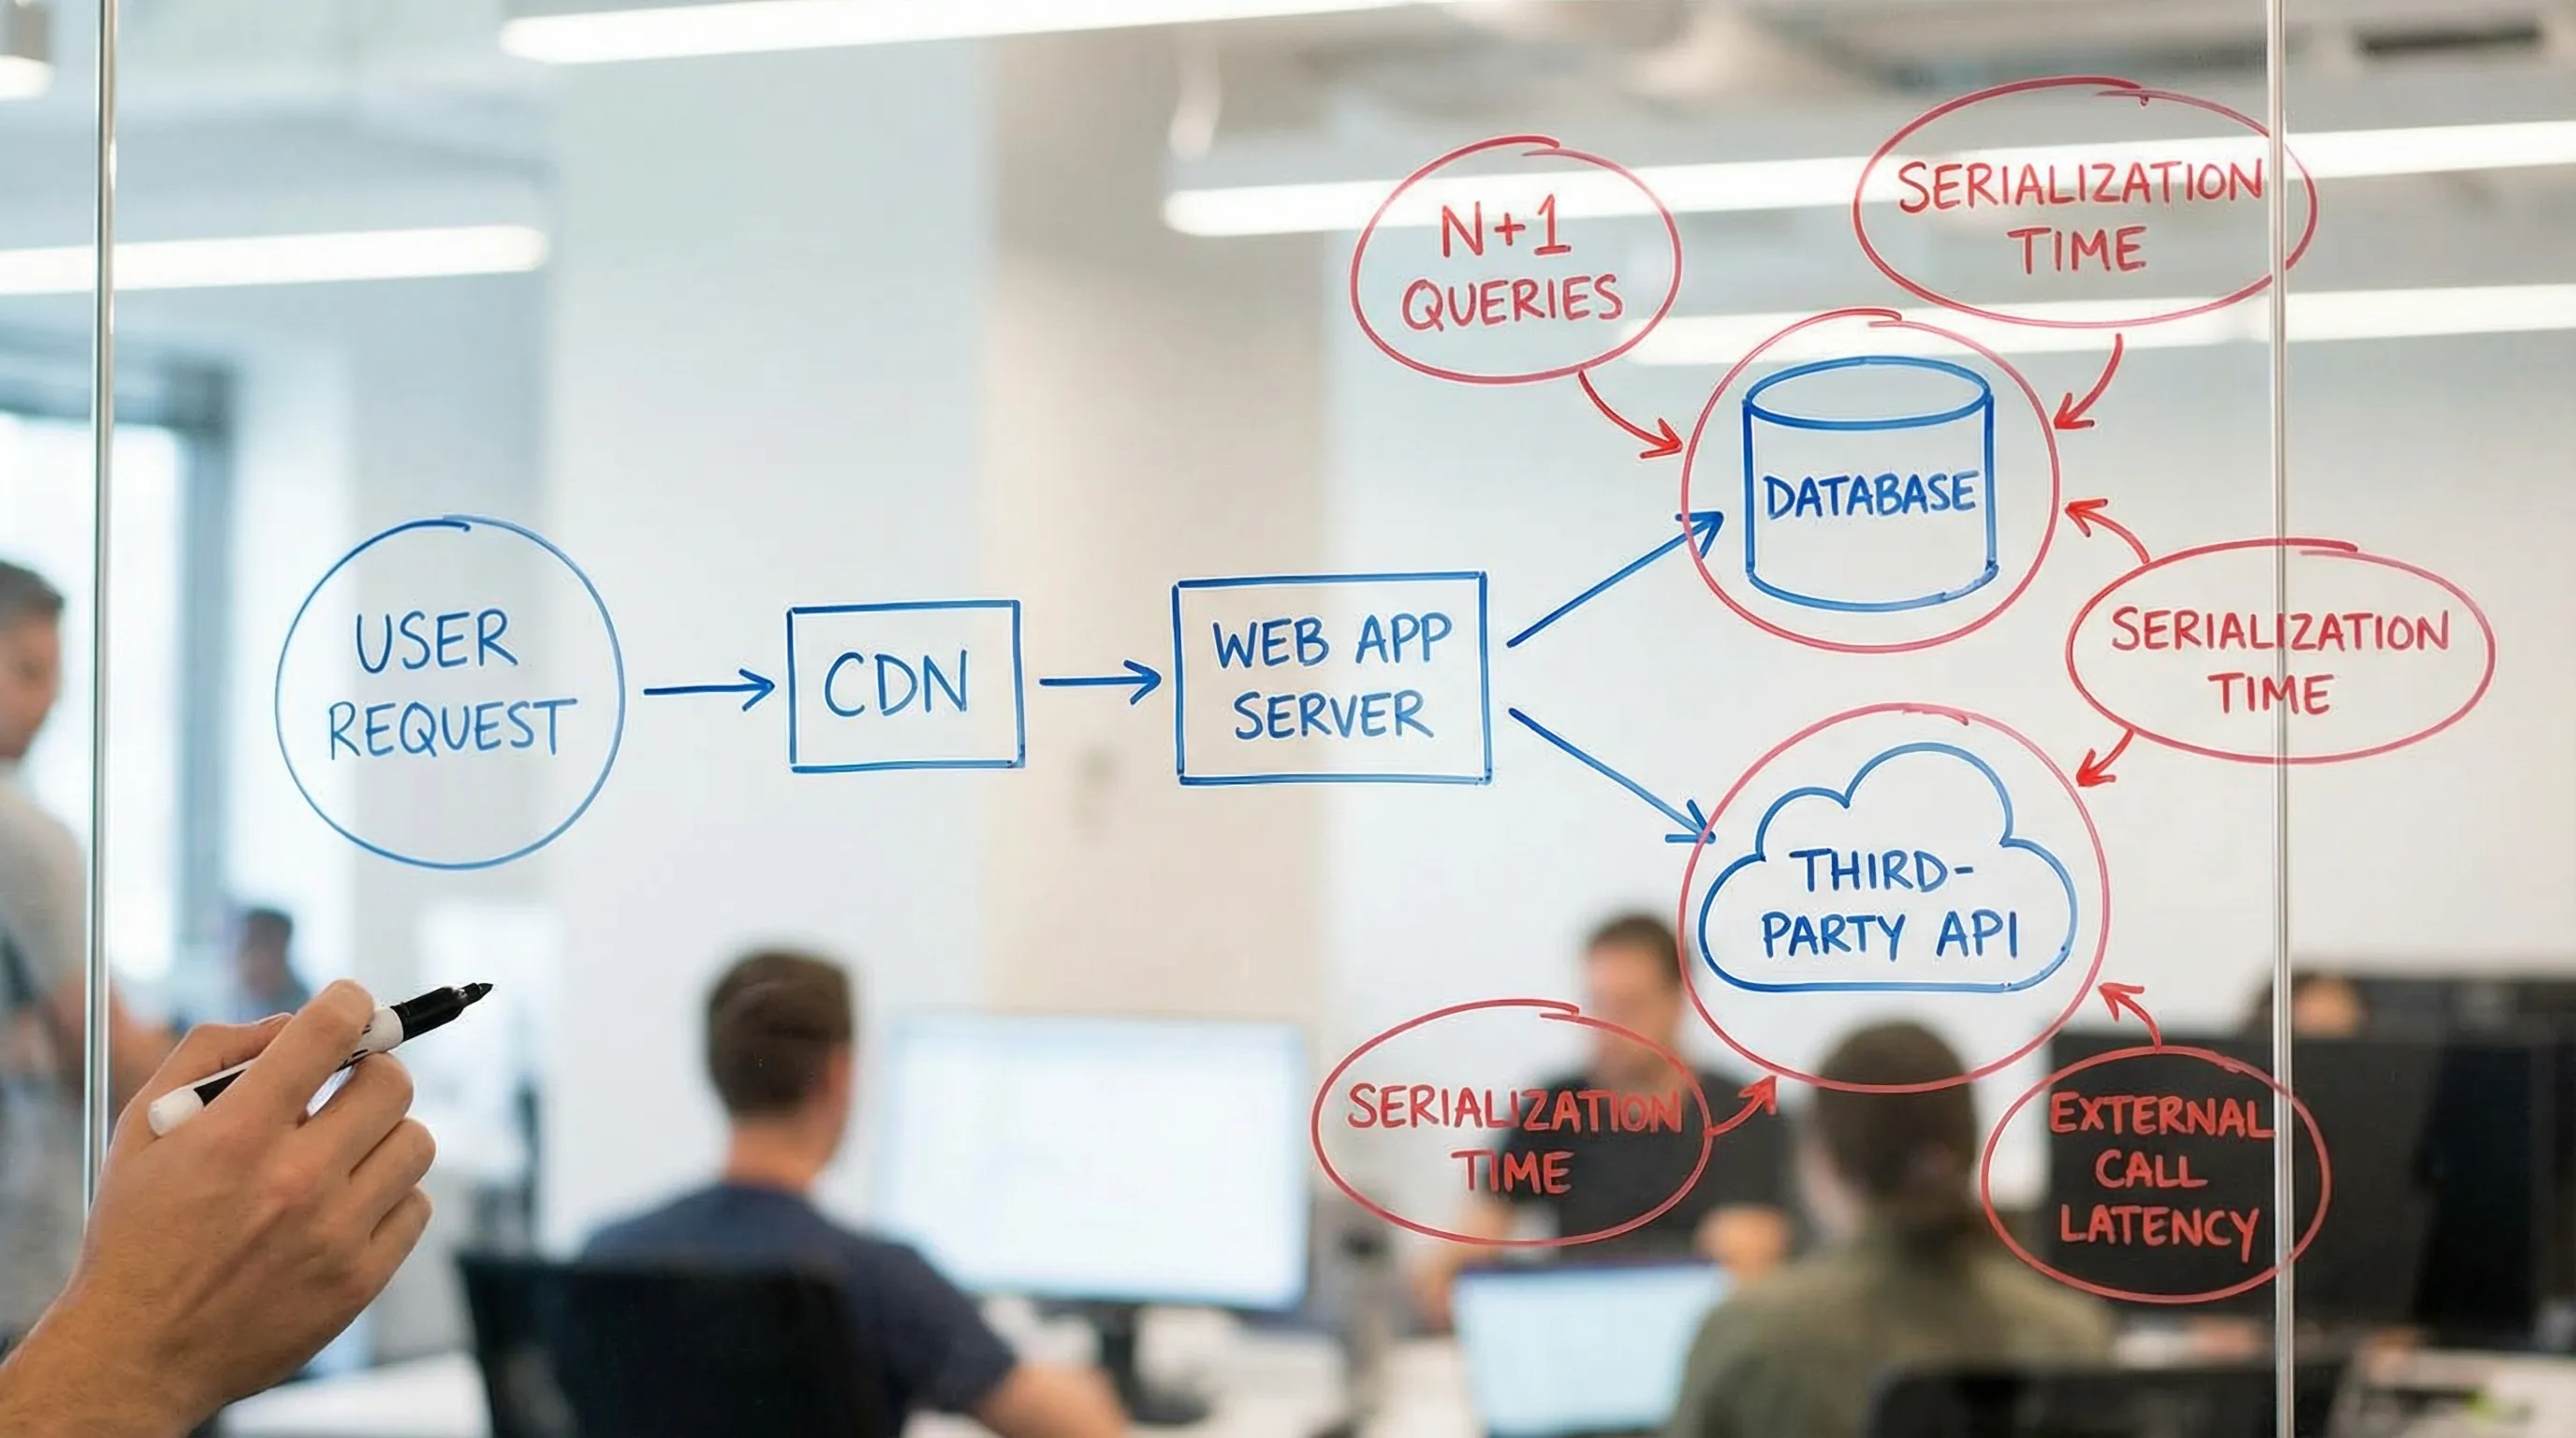
2) Reduce round trips and “chatty” I/O
Many applications are slow because they do too many small remote calls:
- N+1 database queries
- N+1 calls to a downstream service
- Multiple sequential API calls where one batched call would do
- Repeated calls that could be cached for seconds
High-impact fixes often look like:
- Batching: fetch collections in a single query, or introduce batch endpoints.
- Parallelization (carefully): run independent calls concurrently, with strict timeouts.
- Coalescing: deduplicate identical in-flight requests so 100 requests do not all stampede the same dependency.
- Collapsing layers: if you have an extra hop that adds little value, remove it.
Be cautious: “make it parallel” can increase load on downstream systems. The goal is not more concurrency, it is less waiting and less total work.
3) Make data access predictable (usually where the biggest wins live)
If you want to optimize the code for real, start where your data lives. Query shape and indexes can dwarf almost any application-level tweak.
Fix query shape before tuning application code
Common high-impact data issues:
- Missing or wrong indexes
- Queries that scan large ranges and filter late
- Sorting large result sets without supporting indexes
- Returning too much data and doing filtering in application code
- Lock contention from long transactions
What “good” looks like:
- Queries are bounded (by tenant, time range, cursor)
- Pagination is cursor-based where deep paging is possible
- You avoid expensive per-row operations in the request path
- You can explain and reproduce slow queries via logs and traces
Introduce caches that are explicit and safe
Caching is powerful when it is:
- Bounded (size and TTL)
- Observable (hit rate, eviction rate)
- Correct (clear invalidation rules)
High-impact cache targets:
- Reference data that changes rarely
- Derived views that are expensive to compute but cheap to serve
- Authorization and policy checks with short TTLs
- Results of expensive third-party calls, with graceful fallback
Avoid “random caching” that is not tied to a measured bottleneck. It creates correctness risks and hard-to-debug behavior.
4) Move work off the critical path (async and precomputation)
A classic performance trap is doing non-urgent work during user-facing requests.
Examples of work that often belongs outside the request path:
- PDF generation
- Sending emails and notifications
- Webhook deliveries
- Search indexing
- Analytics events
- Report aggregation
High-impact solutions:
- Background jobs with idempotency and retries
- Event-driven flows (outbox pattern, queues) for reliable async processing
- Precomputed read models or materialized views for read-heavy pages
- Streaming: return partial results early if the UX allows it
This is also where legacy systems can be modernized incrementally with low disruption, by introducing seams and moving responsibilities gradually. If you are dealing with older architectures, see Modernizing Legacy Systems Without Disrupting Business.
5) Reduce payload and serialization costs (frontend and backend)
Payload bloat is a silent latency multiplier:
- More time to serialize on the server
- More time to transfer over the network
- More time to parse on the client
- More memory pressure, more GC
High-impact fixes include:
- Returning only what the UI needs (avoid overfetch)
- Compressing responses and being intentional about large JSON blobs
- Using pagination and partial loading
- Optimizing images and fonts for web delivery
If your product includes a React or Next.js frontend, bundle size and rendering strategy can dominate perceived performance. Wolf-Tech has dedicated performance guidance in Next.js Development: Performance Tuning Guide.
The optimization leverage ladder (what to try first)
When teams say they want to “optimize the code,” they often jump to the bottom of this ladder. Start at the top instead.
| Level | What you change | Typical impact | Typical risk |
|---|---|---|---|
| System behavior | Remove work, async, reduce hops | Very high | Medium (requires design discipline) |
| Data access | Query shape, indexes, caching strategy | Very high | Medium (needs correctness and validation) |
| Runtime and infrastructure | Pooling, timeouts, connection limits, autoscaling | High | Medium to high (can affect reliability) |
| Application code | Algorithms, allocation, hot loops | Medium to high (only in true CPU hotspots) | Low to medium |
| Micro-optimizations | Tiny refactors for speed | Low (unless proven hotspot) | Low to medium (can harm readability) |
A practical “high-impact” workflow you can run in 2 weeks
If you want a timeboxed plan that does not turn into an endless performance project, use this structure.
Week 1: Identify and prove the top 1 to 3 bottlenecks
- Pick one critical user journey and define a target (p95, error rate, cost).
- Instrument or improve traces so you can see dependency timing clearly.
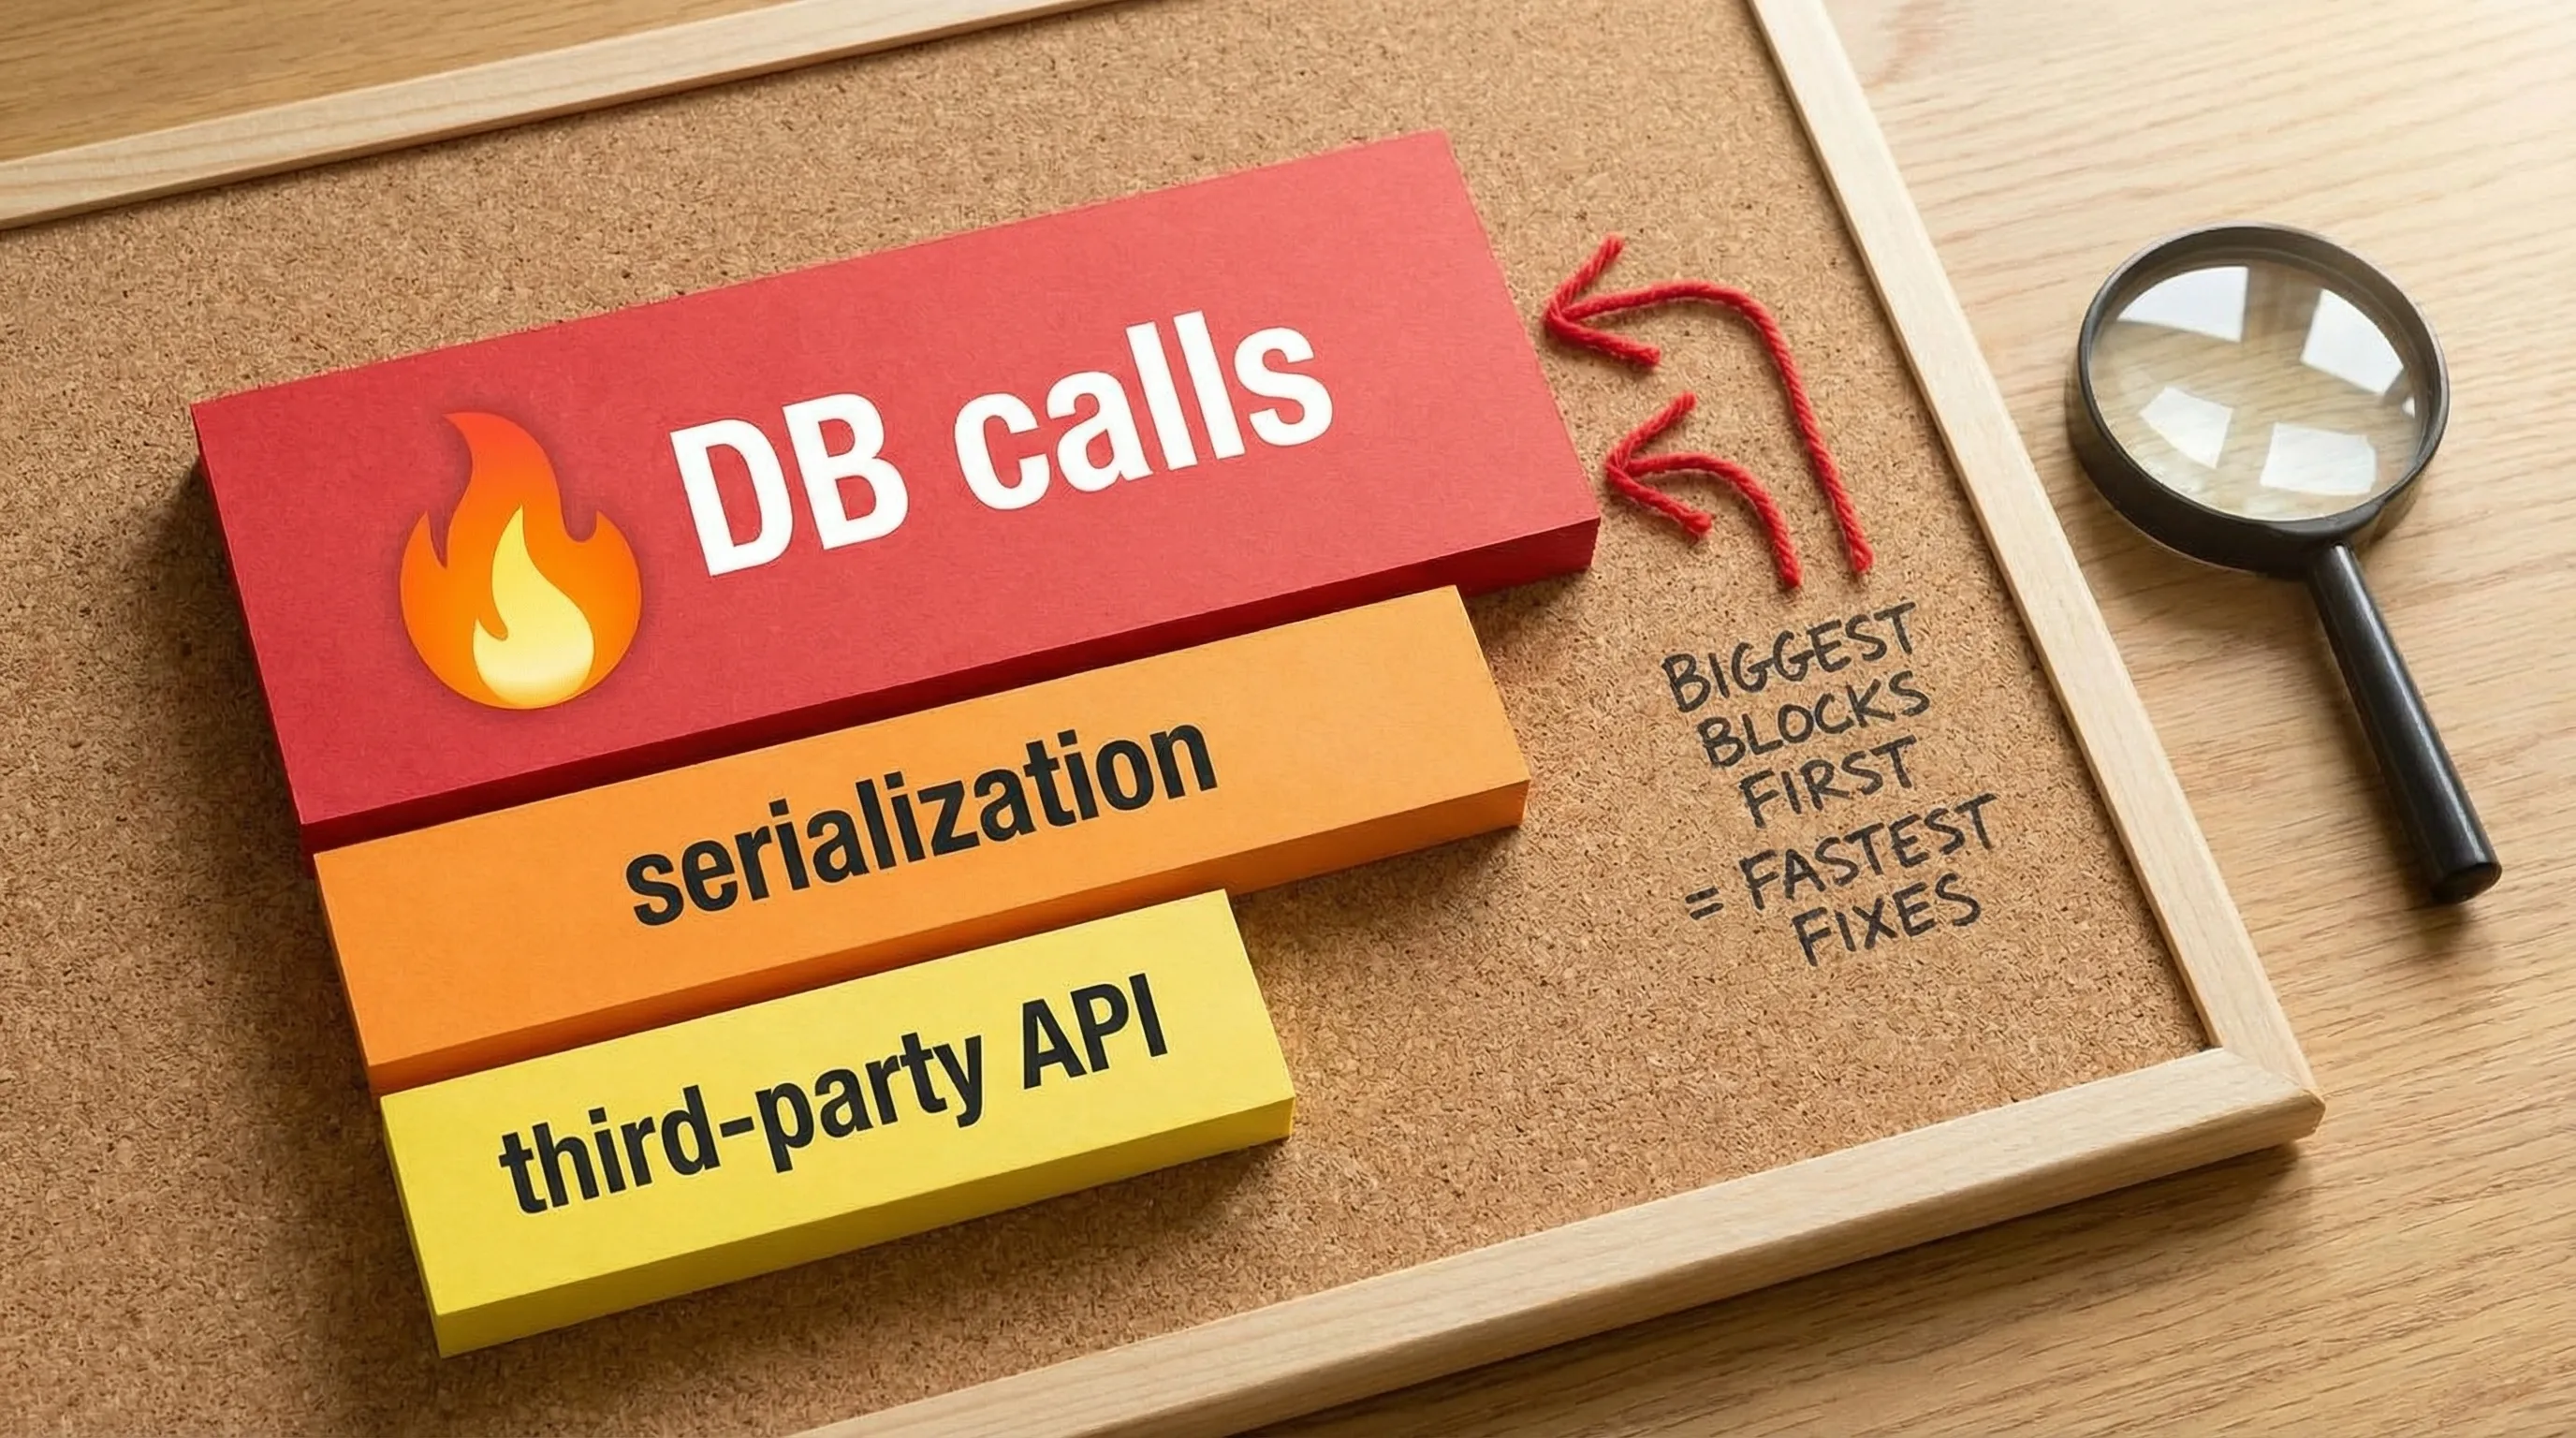
- Pull the top slow traces, then group them by dominant cause (DB, downstream API, serialization, queueing).
- Produce a short bottleneck report with screenshots, example traces, and a hypothesis per group.
Week 2: Apply one high-leverage fix and add guardrails
- Choose the fix with the best impact-to-risk ratio.
- Implement it behind a reversible mechanism when possible (feature flag, config switch).
- Re-measure in production, focusing on p95 and p99.
- Add a regression guardrail (budget, test, alert) so it stays fixed.
A good output of this sprint is not “we improved performance.” It is:
- A repeatable measurement setup
- One proven improvement
- A new engineering guardrail that prevents backsliding
Prevent performance regressions with delivery guardrails
Performance wins often vanish because teams fix a problem once and then regress quietly over months.
High-signal guardrails:
- Performance budgets for key endpoints (latency) and key pages (Web Vitals)
- CI checks that fail on obvious regressions (bundle size, slow unit integration hotspots)
- Canary or progressive delivery to catch issues before full rollout
- Dashboards that track percentiles, not just averages
This is closely connected to delivery maturity. If you need to strengthen the system that ships changes safely, Wolf-Tech’s CI/CD technology guide provides a solid baseline.
When optimization is blocked by the codebase (and what to do)
Sometimes the bottleneck is not a single query or function. It is that the code is too tangled to change safely.
Signals you are in this situation:
- You cannot reproduce behavior locally.
- Small changes create unexpected side effects.
- No one trusts refactors, so everything becomes additive.
- Performance fixes are risky because you cannot lock behavior with tests.
In those cases, the highest impact “optimization” is often:
- Adding characterization tests around hotspots
- Refactoring to create seams
- Isolating high-churn or high-cost modules
That is why performance and maintainability are not competing goals. They are often the same goal. A pragmatic way to approach this is outlined in Refactoring Legacy Applications: A Strategic Guide.
How Wolf-Tech helps teams optimize the code without guesswork
Wolf-Tech specializes in full-stack development and code quality consulting, with deep experience in legacy code optimization, modern web application development, and cloud and DevOps practices. When teams engage Wolf-Tech for performance work, the goal is not one-off tuning, it is a measurement-driven improvement plan that you can sustain.
If you need help identifying bottlenecks, fixing hotspots safely, or modernizing a legacy system so it can perform and scale, explore Wolf-Tech’s work at wolf-tech.io and reach out for an assessment.