
Performance Software Tuning: A Measurement-First Workflow


Most performance work fails for the same reason: teams start changing code before they can measure what users actually experience.
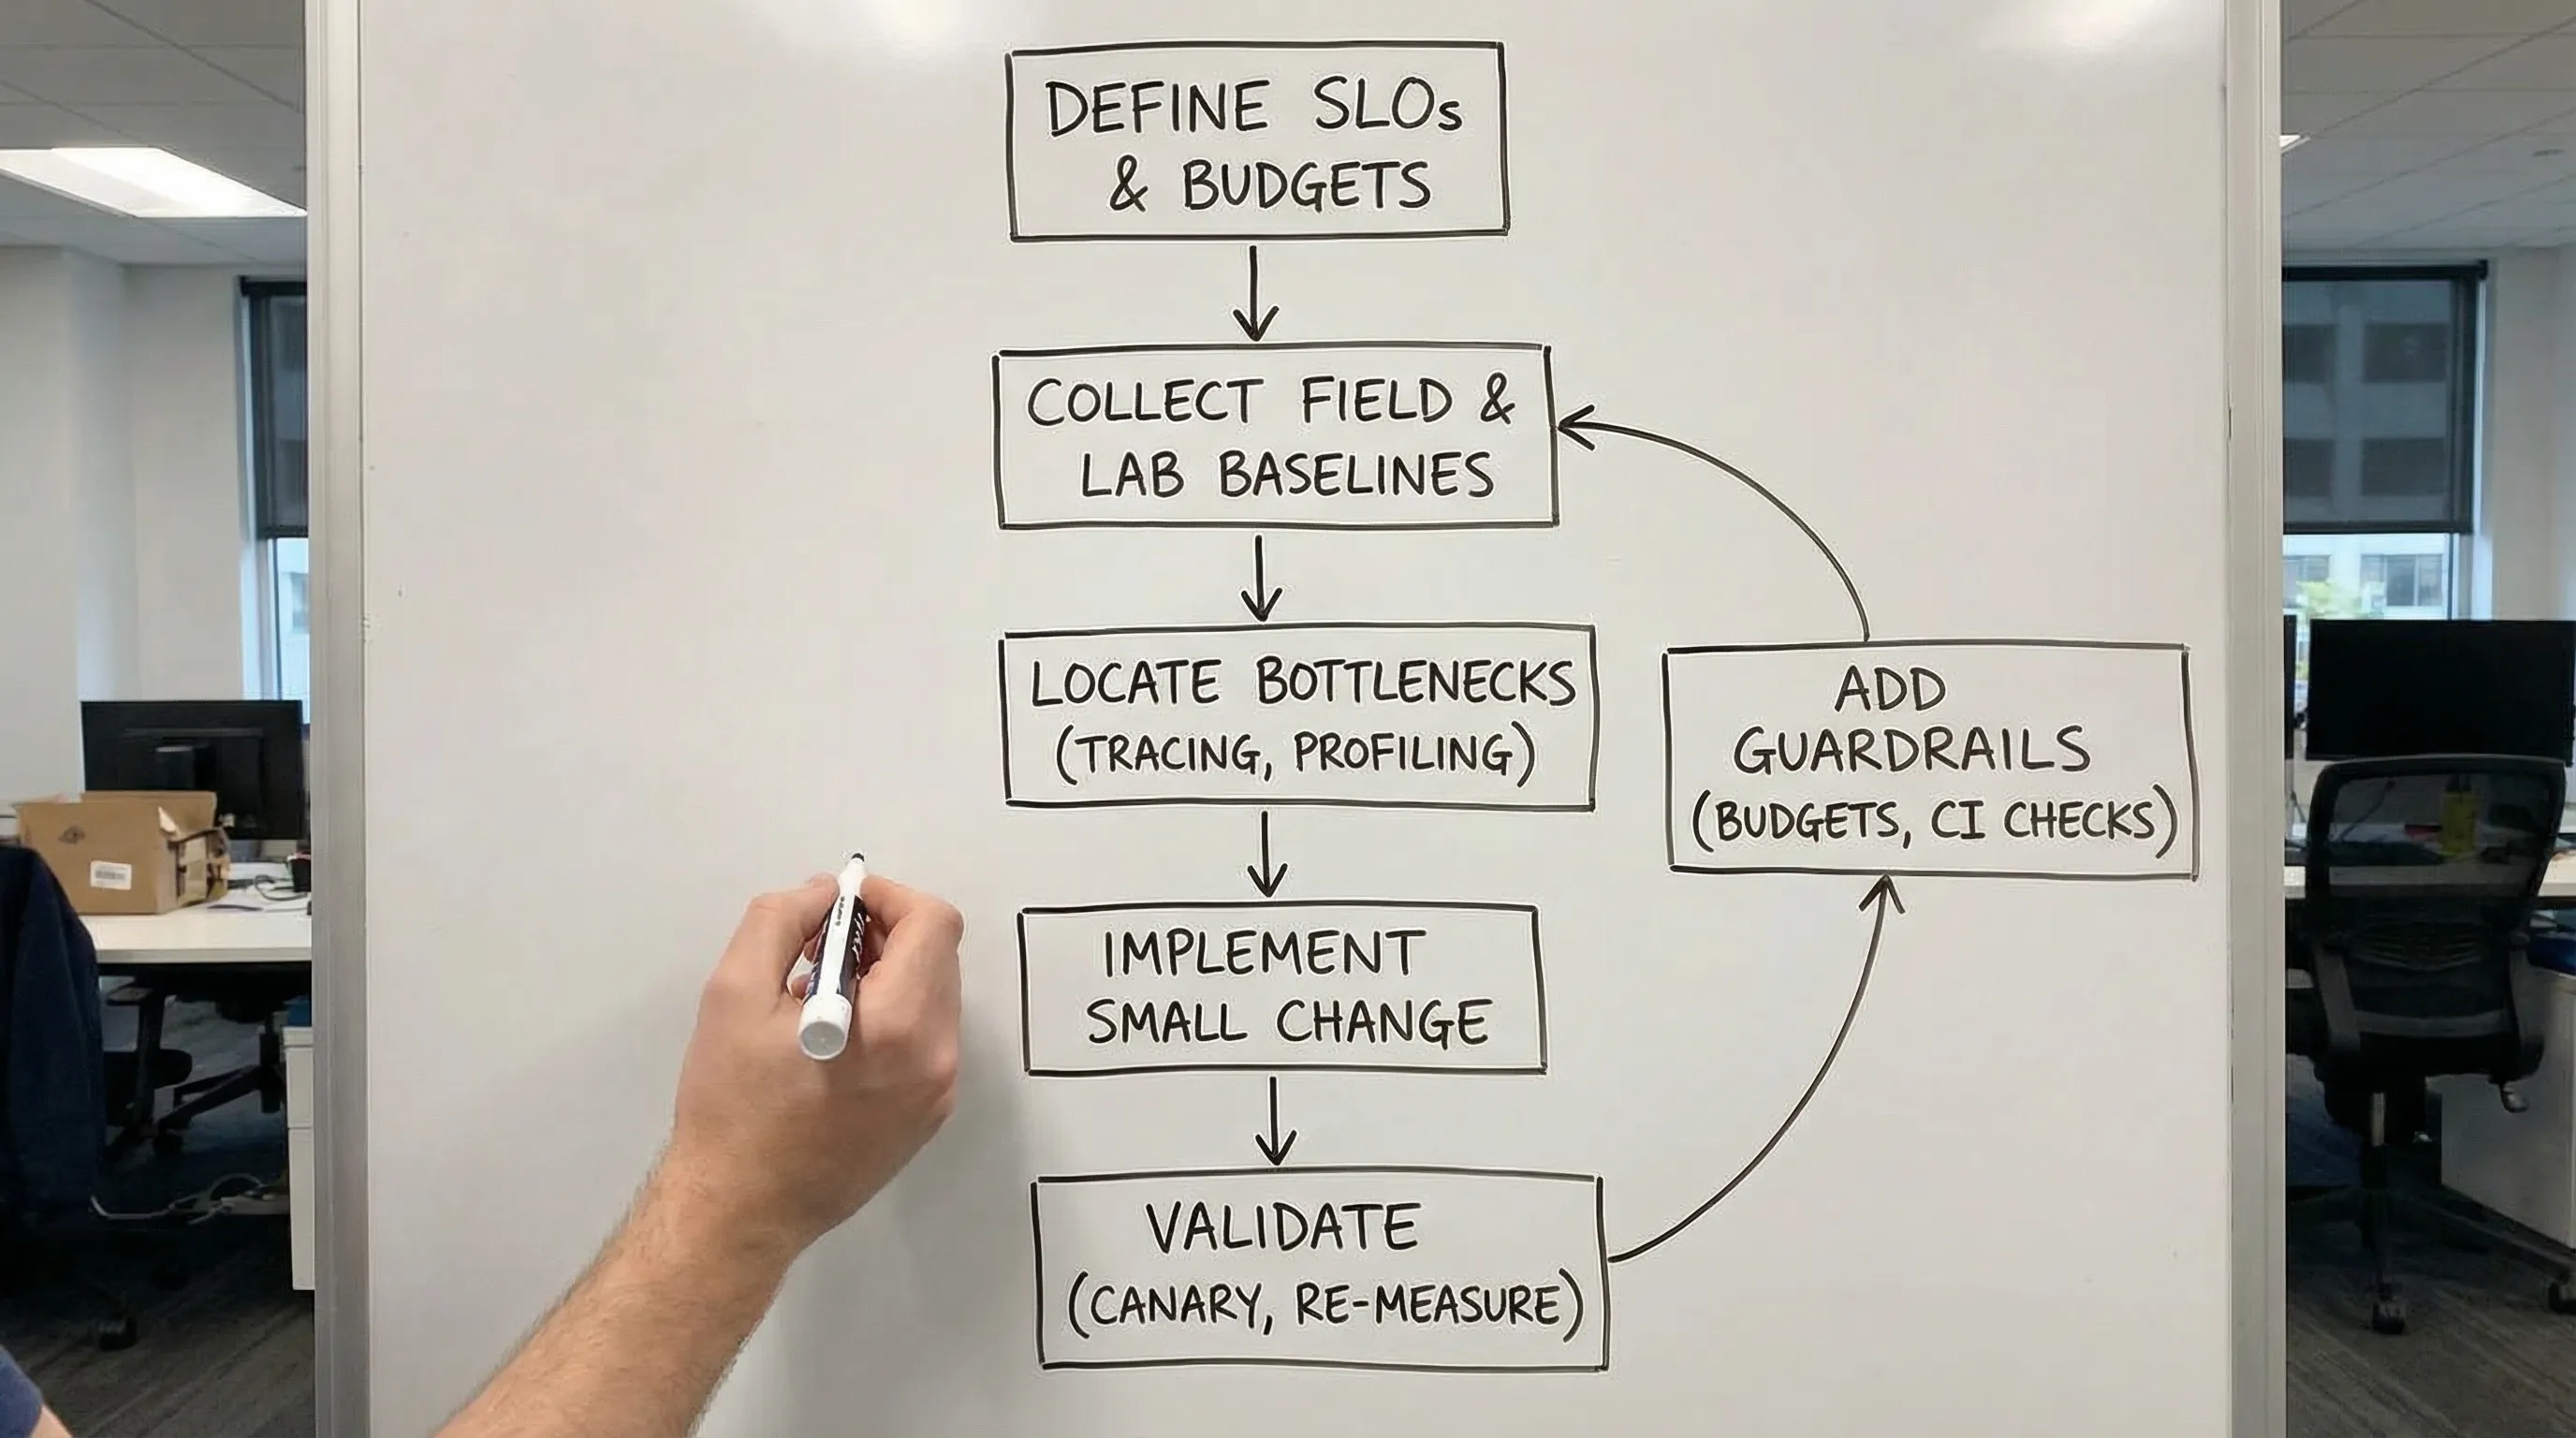
A measurement-first workflow flips that order. You first define what “fast enough” means, establish a baseline, pinpoint the bottleneck with evidence, make a small high-leverage change, then re-measure. You end up with fewer risky rewrites, fewer placebo optimizations, and a system you can keep fast over time.
What “performance” really means in performance software
When someone says “the app is slow,” they usually mean one of these:
- Latency: how long a request or user interaction takes (watch p95 and p99, not averages).
- Throughput: how many jobs, requests, or events you can process per second.
- Resource efficiency: CPU, memory, database load, network egress, queue depth.
- User-perceived responsiveness: page load and interaction metrics (for web: Core Web Vitals).
The practical mistake is treating performance as a single number. In reality, every user journey has its own critical path and its own acceptable “budget.”
For web apps, Google’s Core Web Vitals are a common user-centric baseline. The definitions and current guidance live on web.dev. For React-specific tuning, Wolf-Tech’s guide on fixing LCP, CLS, and TTFB in React is a good companion.
Step 0: Define success with SLIs, SLOs, and a performance budget
Before you profile anything, make the target explicit.
- SLI (Service Level Indicator): what you measure (example: “HTTP request duration for GET /checkout”).
- SLO (Service Level Objective): the threshold (example: “p95 < 400 ms”).
- Budget: how much latency, CPU, or client JS you can “spend” before the experience or cost becomes unacceptable.
A simple SLO set that works for many B2B SaaS and transactional systems:
| User journey or API | Primary SLI | Recommended view | Example SLO target (illustrative) | Notes |
|---|---|---|---|---|
| Login + initial app load | TTFB, LCP (web) | p75 field metrics | LCP within Web Vitals “good” | Use field data because real devices and networks matter. |
| “Search / list” results | API latency | p95 and p99 | p95 < 300-600 ms | List endpoints are often DB-bound and sensitive to data growth. |
| “Checkout / submit” action | End-to-end transaction time | p95 | p95 < 1-2 s | Include external dependencies (payments, email, fraud checks) if user waits. |
| Background processing | Queue lag, job duration | p95 | Lag < X minutes | Define what “fresh enough” means for the business. |
If you already publish operational targets (or want to), this pairs well with a reliability model using SLIs and error budgets. Wolf-Tech’s backend reliability best practices covers that mindset.
Step 1: Establish a baseline (field first, lab second)
You need two baselines, because they answer different questions.
Field baseline (real users)
Field measurement tells you what customers actually experience, across real devices, networks, geographies, and caches.
What to capture:
- RUM (Real User Monitoring) for web: LCP, CLS, INP, TTFB, route transitions, JS errors.
- Server metrics: request duration histograms, error rates, saturation (CPU, memory), queue depth.
- Distributed traces: end-to-end spans across API gateway, services, databases, and third parties.
If you are standardizing observability, OpenTelemetry is the most common vendor-neutral path for traces, metrics, and logs. The canonical docs are at opentelemetry.io.
Lab baseline (controlled reproduction)
Lab measurement (synthetic checks, Lighthouse, load tests, profiling in staging) is how you reproduce issues and validate fixes quickly.
The key is representative workloads:
- Representative data size (a “big” customer account, not an empty dev tenant)
- Representative concurrency
- Representative integrations (or realistic stubs)
If your lab test is too clean, you will optimize for a world your users do not live in.
Step 2: Locate the bottleneck with a system map
Once you have a baseline, create a quick “performance map” of the critical path. You are trying to answer: where is time actually going?
A practical, evidence-driven approach is to categorize symptoms into:
- Work: too much computation or too much I/O
- Waiting: contention, lock waits, thread pool starvation, queue backlog
- Wasted work: repeated queries, over-fetching, unnecessary rendering, duplicate API calls
A useful mental model here is Brendan Gregg’s USE method (Utilization, Saturation, Errors) for quickly spotting resource bottlenecks. His write-up is available at brendangregg.com.
At this stage, resist “fix ideas.” Your goal is a high-confidence statement like:
p95 latency regressed because DB time for query X increased after data growth, and the application is serially waiting on three round trips per request.
That sentence is worth more than a week of speculative refactors.
Step 3: Reproduce and isolate (profiling, tracing, and query plans)
Different bottlenecks require different tools. The workflow is consistent, but the “microscope” changes.
If the bottleneck is in the database
High-signal evidence usually includes:
- Slow query logs
- Query plan analysis (and whether indexes are used)
- N+1 patterns (many similar queries per request)
- Lock contention and long transactions
Isolation tactic: take one representative endpoint, capture a trace, then align spans with the exact SQL and its plan. If you cannot connect traces to specific queries, add instrumentation first.
If the bottleneck is in the backend application
You are often looking for:
- Hot methods in CPU profiles
- Excess allocations and GC pressure
- Thread pool or async executor starvation
- Serialization and validation overhead in hot paths
Isolation tactic: compare profiles of “fast” vs “slow” runs under the same load, not two different environments.
If the bottleneck is in the frontend
Evidence usually includes:
- Long tasks and main-thread blocking
- Hydration or rendering cost
- Bundle size and code-splitting misses
- Waterfalling data fetches
Isolation tactic: measure route-level transitions and identify which requests or JS chunks gate interactivity. Wolf-Tech’s Next.js performance tuning guide dives deeper into that path for Next.js apps.
Step 4: Make one small change, then re-measure (experiment design)
Performance tuning is engineering, not art. Treat each change like an experiment.
A good performance change has:
- A hypothesis: “Removing one network round trip will reduce p95 by 120 ms.”
- A primary metric: the SLI you are trying to move.
- A rollback plan: feature flag, config switch, or a clean revert.
- A blast-radius control: canary releases, percentage rollout, or tenant-based rollout.
If you change five things at once, you will not learn which one mattered, and you will not build a repeatable tuning capability.
High-leverage fixes (the ones that usually move the needle)
Once you have a proven bottleneck, these fix families tend to produce the biggest gains across performance software systems.
1) Reduce round trips and serialization overhead
Typical wins:
- Collapse chatty request patterns into fewer calls
- Batch reads and writes
- Avoid re-fetching data already known to the system
Round trips are latency multipliers. Tail latency gets especially painful when multiple dependencies stack on the same critical path.
2) Make data access predictable
Typical wins:
- Add or correct indexes based on real query patterns
- Remove N+1 queries
- Rewrite “flexible but slow” queries into explicit, well-bounded ones
This is also where “it worked in staging” failures often come from: production data distributions change everything.
3) Move work off the critical path
Typical wins:
- Use background jobs for non-essential work (emails, reports, heavy computation)
- Use async processing patterns where the user does not need synchronous completion
- Stream or progressively render where appropriate (web)
The goal is not to make everything async. The goal is to keep the user’s waited-on path short and reliable.
4) Cache deliberately, with invalidation rules you can operate
Caching can be a major accelerator or a long-term source of correctness bugs. Make it explicit:
- What is cached (key and value shape)
- TTL and eviction behavior
- Invalidation triggers
- How you measure cache hit rate and impact on p95
5) Remove wasted work
This is the “quiet killer” category:
- Doing expensive validation twice
- Rendering UI that is immediately replaced
- Loading third-party scripts that block the main thread
- Logging or debug features accidentally left on in hot paths
Wolf-Tech’s article on high-impact code optimization beyond micro-optimizing is aligned with these categories, but the key here is that you only pick the fix after measurement confirms the bottleneck.
Step 5: Prevent regressions (performance as a product capability)
The “tuning” part is not the hard part. Keeping performance stable through constant change is.
Add performance budgets
Budgets turn performance from “a concern” into an enforceable constraint. Examples:
- Max route-level JS size
- Max number of queries per request
- Max p95 for a critical endpoint under a defined load
Put checks in CI
Good CI checks are fast and repeatable. Options include:
- A focused load test for the top 3 endpoints
- A route-level Lighthouse check for key pages
- A regression threshold on server-side p95 in a controlled environment
Tag releases in observability
If you cannot correlate a regression with a deployment, you will waste time. Ensure every metric and trace can be sliced by:
- service
- version / commit SHA
- environment
- tenant (when applicable)
This is one of the simplest ways to turn performance work into a steady operational practice instead of a recurring fire drill.
A practical 10-day measurement-first tuning sprint
If you need a lightweight way to execute this quickly, here is a pragmatic sprint structure that fits most teams.
| Timebox | Goal | Deliverables you can verify |
|---|---|---|
| Days 1-2 | Define targets and baseline | SLIs/SLOs, dashboards, top slow journeys/endpoints list, baseline p95/p99 |
| Days 3-4 | Pinpoint bottleneck | 1-2 traces showing dominant time sink, reproduced in lab or staging where possible |
| Days 5-7 | Implement smallest high-leverage fix | One change behind a flag, clear rollback, before/after measurements |
| Days 8-9 | Validate safely in production | Canary rollout results, error impact checked, cost impact checked |
| Day 10 | Add guardrails | Budget, CI/smoke check, alert thresholds, runbook notes |
Notice what is missing: a broad refactor. If the best fix truly is structural, you will discover that with evidence, and you can plan it like a product investment instead of a panic rewrite.
When a performance review is worth outside help
Bring in an external performance review when:
- You lack trustworthy observability and need a clean baseline fast
- Tail latency is hurting revenue or customer retention and you cannot isolate the bottleneck
- The system is legacy-heavy and changes carry high release risk
- Your team keeps “tuning” but regressions keep returning
Wolf-Tech helps teams build and tune performance software systems across the full stack, from observability baselines and legacy optimization to safe rollout strategies. If you want a measurement-first performance plan tailored to your architecture and constraints, start at wolf-tech.io.