
Custom Software Development: Cost, Timeline, ROI


If you are budgeting for custom software in 2025, three questions dominate the conversation: what will it cost, how long will it take, and what ROI should we expect. This guide gives decision makers a practical, numbers-first way to answer all three, along with the levers that materially change the outcome.
What really drives the cost of custom software
The biggest mistake in early budgeting is treating “a web app” or “a platform” as a single line item. Cost and timeline swing based on a handful of drivers you can assess in week one.
| Cost driver | What to look for early | Impact on cost and risk |
|---|---|---|
| Scope breadth | Number of personas, core use cases, environments, languages | More flows multiplies design, development, testing, and UAT effort |
| Integrations and data | Count of systems, API quality, data migration, auth methods | Integration work often dominates complexity and defect risk |
| Nonfunctional requirements | Availability SLOs, performance targets, data residency | Higher SLOs, real time features, and multi region add architecture and testing cost |
| Compliance and security | PII, payments, audit trails, logging, retention | Threat modeling, encryption, reviews, and pen tests increase scope |
| UX and interaction complexity | Real time collaboration, offline, accessibility, design system | Complex UX requires deeper design and front end engineering |
| Legacy constraints | Tight coupling to old systems, strangler pattern, dual writes | Increases orchestration, migration, and rollback needs |
| Team model and location | In house, partner, hybrid, time zones | Onboarding time and coordination overhead affect burn rate |
| Change management | Training, communications, docs, enablement | Underestimating adoption work delays time to value |
A quick discovery can quantify these drivers and produce a tighter budget envelope before you commit to a full build. If you are still deciding build versus buy, use this early signal together with a three to five year TCO model. For a structured approach, see our guide on when to choose custom solutions over off the shelf.
Typical budget ranges and what you get
Every project is unique, but the following ranges reflect common patterns we see in the US and Europe with blended teams and modern tooling. Treat them as planning anchors, then refine with discovery.
| Category | Timeline | Typical budget (USD) | What you get | Team profile |
|---|---|---|---|---|
| Prototype or internal automation | 6 to 10 weeks | 60,000 to 120,000 | A thin vertical slice or internal tool, 1 to 2 integrations, basic auth, metrics, CI/CD | 2 to 3 engineers, part time product and QA |
| Market ready MVP | 3 to 4 months | 150,000 to 350,000 | Core features, 4 to 8 integrations, solid UX, observability, security baseline, staging and production | 4 to 6 engineers, designer, product lead, QA |
| Department or enterprise platform | 6 to 12 months | 500,000 to 2,500,000+ | Multiple modules, complex workflows, compliance, multi region or high availability, analytics, rollout plan | 2 to 3 cross functional squads with platform support |
Numbers vary based on the cost drivers above, the talent market, and the ratio of new build versus modernization. If heavy legacy integration or regulated data is in scope, expect the higher end of each range.
How long should you plan for
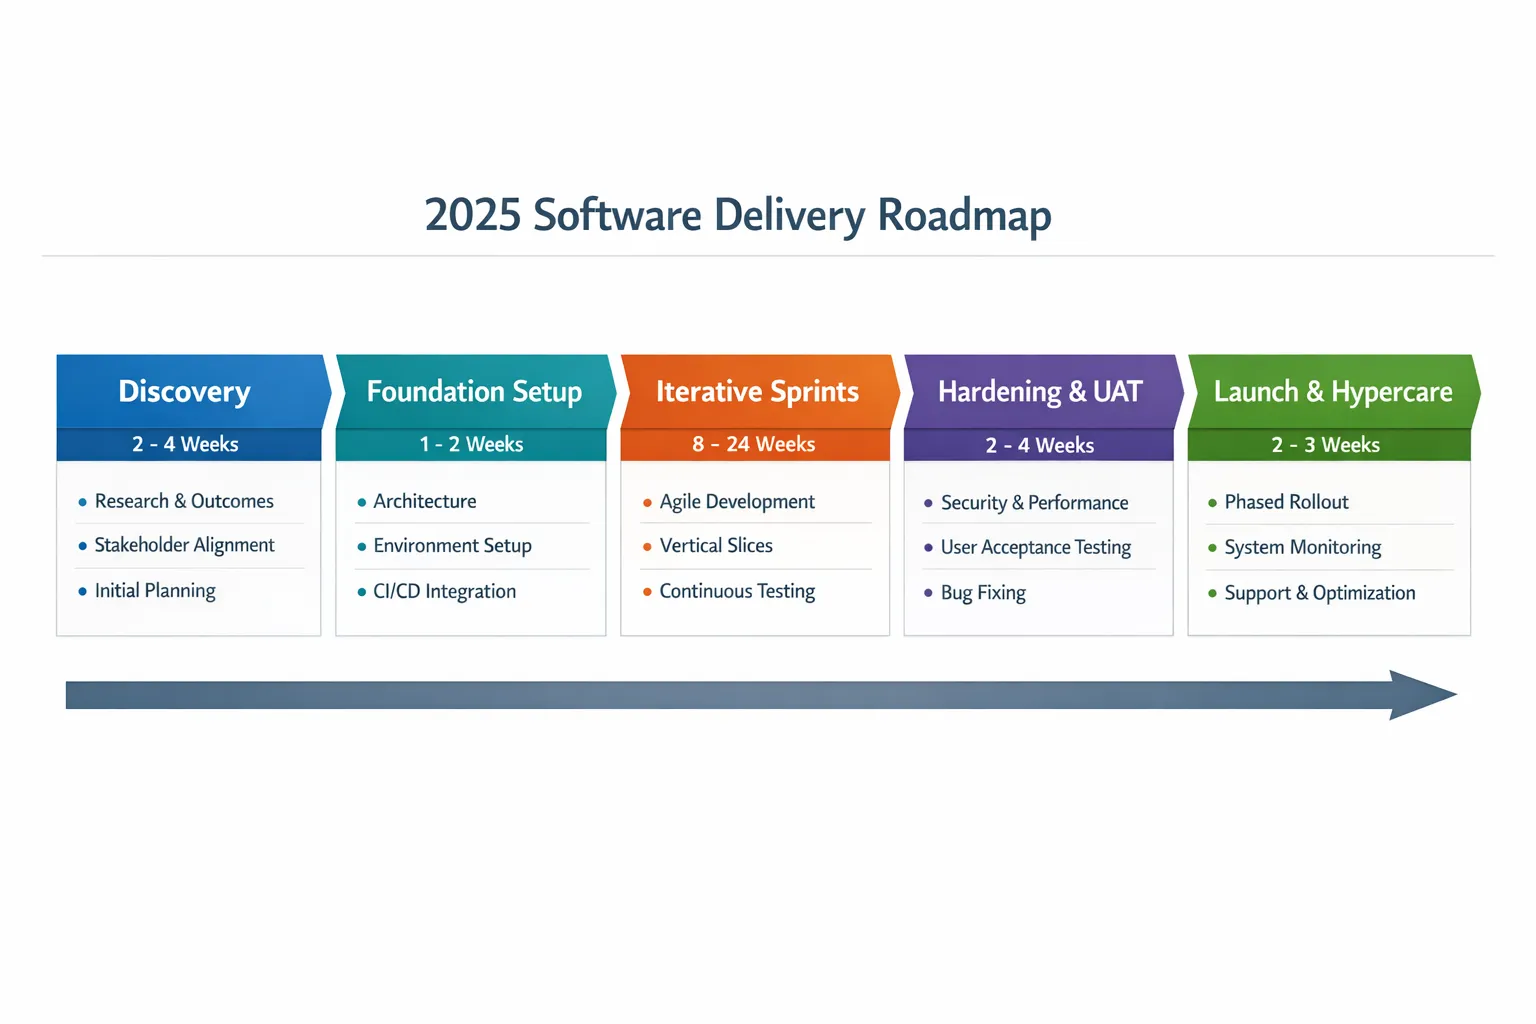
Most successful deliveries follow a predictable shape. Treat these as time boxes with clear exit criteria, not calendar fillers.
- Discovery and scoping, 2 to 4 weeks. Outcomes, measurable objectives, prioritized backlog, architecture baseline, risk register, initial budget and ROI model.
- Foundation setup, 1 to 2 weeks overlapping. Repo and branches, environments, CI/CD, observability, access control, paved paths for services and front end.
- Iterative delivery, 8 to 24 weeks in two week sprints. Thin vertical slices that trace to outcomes, demo every sprint, production hardening every third sprint.
- Hardening and UAT, 2 to 4 weeks. Nonfunctional testing, performance runs, security review, training and enablement, migration plan and rollback tested.
- Launch and hypercare, 2 to 3 weeks. Phased rollout, canaries and feature flags, runbooks, dashboards, on call and error budget in place.
Want a deeper dive on architecture choices that keep timelines under control, including why modular monoliths are often fastest for v1? See our guide on how to choose the right tech stack in 2025.
How to reduce cost and time without cutting corners
A few proven moves consistently compress schedules and budgets while increasing quality.
- Prioritize outcomes, not features. Trim anything that does not move your primary KPIs in the first 90 days.
- Prove the riskiest assumptions first. Use a time boxed spike to validate integration feasibility, performance, or a critical UX flow.
- Default to a modular monolith for v1. Keep latency low, refactor costs manageable, and deployment simple. Split later when needed.
- Buy where you do not differentiate, build where you do.
- Invest in platform basics on day one. Trunk based development, CI/CD with tests, preview environments, and observability reduce rework later. Our application development roadmap for growing teams explains a pragmatic path.
- Modernize safely if legacy is in play. Use the strangler pattern, contract tests, and shadow traffic. See our playbook for modernizing legacy systems without disrupting business.
ROI modeling that finance and product both trust
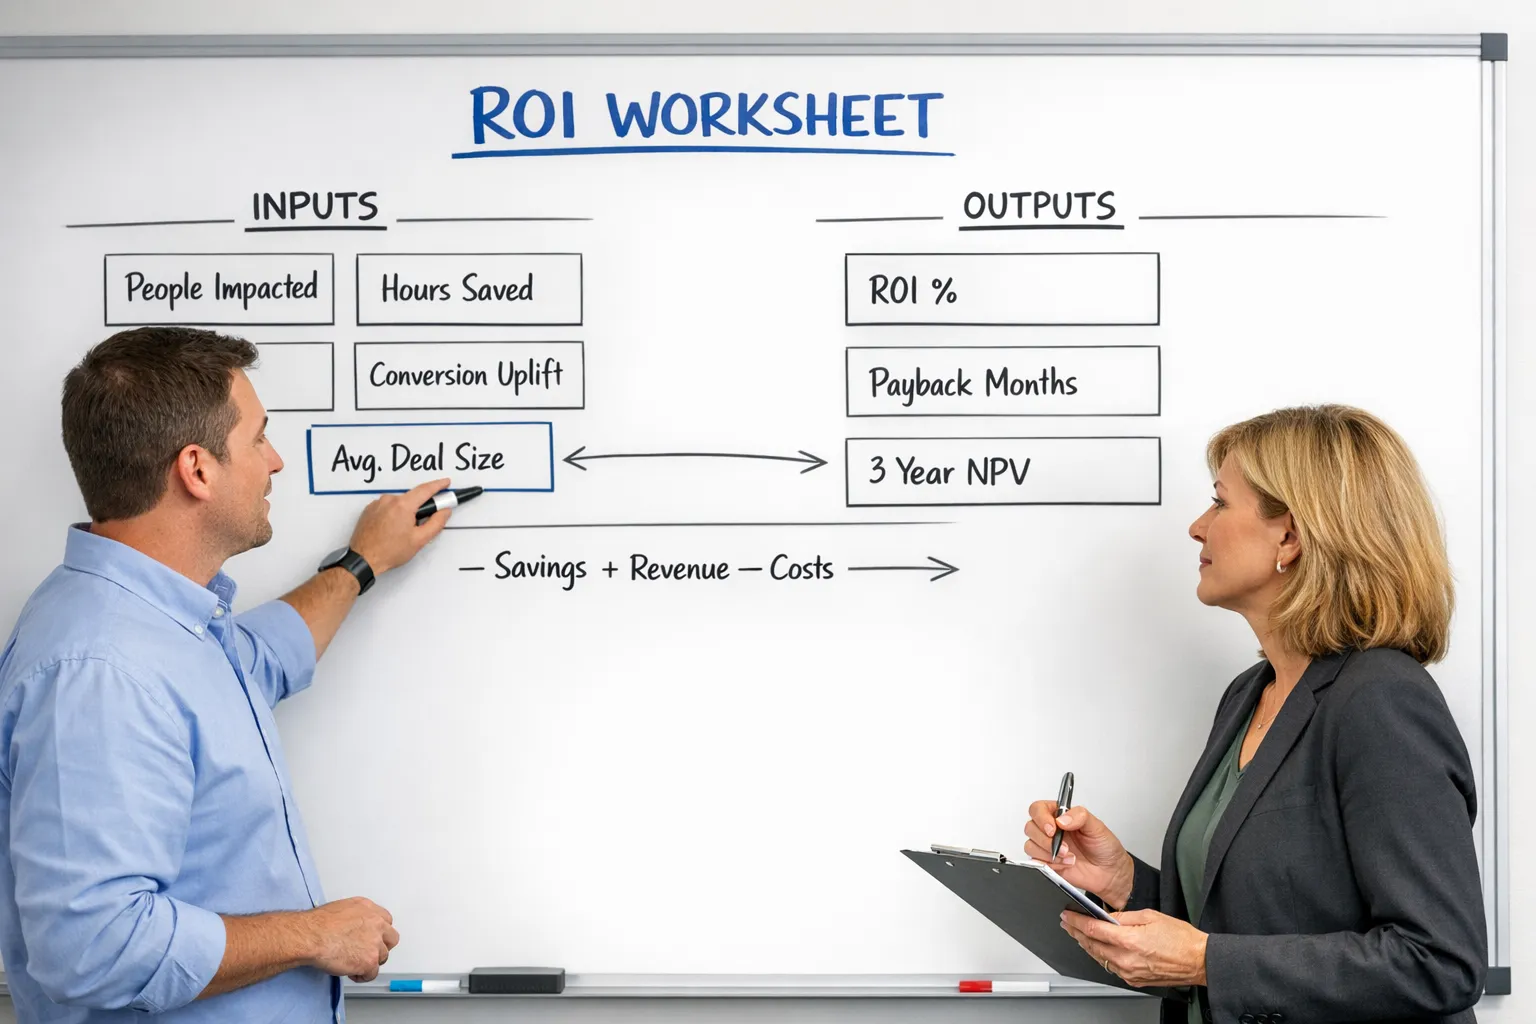
The fastest way to align executives is a simple, transparent model you can update as reality changes. Use a one page sheet with three sections: benefits, costs, and time value of money.
Benefits categories to quantify
- Revenue uplift, new bookings, higher conversion, higher average order value, expansion revenue.
- Cost savings, hours saved, fewer tools, reduced rework and defect rates, lower support tickets.
- Risk reduction and compliance, avoided fines or audit costs, reduced outage costs, reduced vendor lock in risk.
- Strategic option value, speed to experiment, faster partnership integrations, faster geographic entry.
Track these with baseline measurements before kickoff. Adoption metrics are crucial, because benefits only accrue if people use the product in their daily work.
Cost categories to include
- Build costs, discovery, design, development, testing, and project management.
- Run costs, cloud and third party licenses, monitoring, incident response, security reviews.
- Change costs, training, documentation, comms, internal admin time.
The three equations you need
- ROI, over your chosen period. ROI equals total benefits minus total costs, divided by total costs.
- Payback period in months. Payback months equals twelve times initial build cost divided by annualized net benefit, net benefit equals annual benefits minus annual run costs.
- Net present value. NPV equals the sum of discounted future net cash flows minus initial build, use your finance team’s discount rate, commonly 8 to 12 percent.
A worked example, year one
Assume a new internal platform that reduces manual admin and improves conversion:
- Initial build cost, 280,000 dollars.
- Annual run costs, 70,000 dollars.
- Annual benefits, 600,000 dollars (labor savings plus modest revenue uplift).
Results:
- Year one ROI equals, 600,000 minus 350,000, divided by 350,000, which is about 71 percent. We used total year one costs of 350,000 dollars, build plus run.
- Payback equals, twelve times 280,000 divided by 600,000 minus 70,000, which is about 6.3 months.
These are illustrative only. Swap in your own numbers and pressure test with sensitivity analysis at plus or minus 20 percent on both benefits and costs.
A simple worksheet you can copy
| Line | Input | Example | Formula |
|---|---|---|---|
| People impacted | count | 50 | |
| Hours saved per person per week | hours | 0.5 | |
| Weeks per year | weeks | 48 | |
| Loaded hourly cost | dollars | 55 | |
| Annual labor savings | dollars | 66,000 | People x Hours x Weeks x Rate |
| Additional annual revenue | dollars | 400,000 | Conversion uplift x average deal value |
| Risk avoidance value | dollars | 30,000 | Finance or compliance estimate |
| Total annual benefits | dollars | 496,000 | Sum of benefits |
| Initial build cost | dollars | 280,000 | |
| Annual run costs | dollars | 70,000 | Cloud, licenses, support |
| Year one ROI | percent | 41 percent | (Benefits minus Build minus Run) divided by (Build plus Run) |
| Payback months | months | 8.0 | 12 x Build divided by (Benefits minus Run) |
Use conservative inputs and agree on how you will verify each benefit after launch.
Hidden costs and how to control them
Underestimated items rarely kill projects, but they do erode ROI. Make them explicit and give each an owner.
| Hidden cost | When it shows up | How to control it |
|---|---|---|
| Data migration and cleanup | Late discovery of messy source data | Profile early, agree on cutover plan, automate validation |
| Test data management | Staging and compliance | Synthetic data generation and masking standards |
| Security reviews and pen tests | Pre launch, especially in regulated sectors | Threat modeling in sprint one, schedule reviews early |
| Observability and analytics | After first incidents, or when product cannot answer basic questions | Instrument from day one, define product analytics events |
| Change management | Just before go live, adoption lags | Training plan, champions, short videos, in app help |
| Vendor and API limits | When usage grows | Rate limit strategy, caching, bulk endpoints, contracts |
Governance that keeps budget on track
- Work to fixed time and fixed team, scope is the variable. Re rank every sprint based on ROI per point.
- Use release gates. Do not exit discovery without outcomes, the budget envelope, and a validated architecture baseline. Do not exit hardening without passing nonfunctional tests.
- Track flow and quality. Lead time, change failure rate, and escaped defects reveal whether you are adding or burning risk.
- Keep a 10 to 20 percent contingency buffer for known unknowns. Release it only with executive sign off.
If you are evaluating delivery partners, run a hands on pilot and score against engineering, security, DevOps, data, and delivery maturity. Our guide on how to vet custom software development companies provides a reusable scorecard.
When custom is the right call, and when it is not
Choose custom when it creates durable advantage, when workflows are unique, or when integration and data ownership are strategic. Choose buy or hybrid when you can achieve 80 percent of the outcome quickly with configurable tools, and reserve custom work for the last mile that differentiates your business. Over a three to five year horizon, model both options’ TCO and risk, not just year one cash.
How Wolf Tech helps
Wolf Tech specializes in full stack engineering that ties technology choices to business outcomes. Teams partner with us for:
- Custom software and web application development that ships value in weeks, not quarters.
- Code quality consulting and legacy optimization to increase developer velocity safely.
- Tech stack strategy, cloud and DevOps foundations, and reliable databases and APIs aligned to your SLOs.
- Industry specific digital solutions, from regulated financial services to fast moving growth businesses.
If you need a pragmatic estimate, a timeline that executives can sign, and an ROI model you can defend, we can help refine the budget envelope through a focused discovery and then deliver iteratively with clear release gates.
Ready to turn a rough idea into a costed plan with a credible timeline and ROI model you can share with finance and the board? Contact Wolf Tech at wolf tech dot io to start the conversation.
Internal resources you may find useful next: